
Financial Search Authority Maturity Model
 The Financial Search Authority Maturity Model provides a structured method for assessing how effectively a financial organisation develops, governs and improves its authority across traditional search, AI-assisted discovery, provider comparison and digital trust environments.
The model forms part of the wider CGO Media Financial Services research architecture and should be read alongside Financial Services SEO in an AI Search Environment, the Financial Services AI Trust Framework, the Financial Provider Selection Model and the Financial SEO & AI Implementation Roadmap.
The maturity model is designed to help banks, lenders, insurers, payment companies, investment organisations, fintechs and other financial providers evaluate whether search visibility is being managed as a collection of isolated marketing activities or as a governed authority system.
1. Purpose of the Financial Search Authority Maturity Model
The purpose of the model is to provide a practical framework for assessing current capability, identifying authority gaps, defining target maturity and prioritising improvement.
2. Search Authority Is a Capability, Not a Campaign
Financial search authority develops through the interaction of:
- Entity clarity
- Financial information authority
- Product authority
- Trust evidence
- External corroboration
- AI search readiness
3. Maturity Measures Organisational Capability
The model does not measure whether a provider has completed a list of SEO tasks.
It measures whether the organisation has repeatable systems for creating, validating, governing and improving financial authority.
4. Mature Financial Search Authority Is Governed
Higher maturity requires more than stronger rankings or broader content coverage.
It requires clear ownership, evidence standards, review processes and change controls.
5. Mature Financial Search Authority Is Resilient
A mature organisation should be better able to adapt when:
- Products change
- Rates change
- Regulation changes
- Brands change
- Search systems change
- AI systems change
6. Mature Financial Search Authority Is Evidence-Led
Decisions should increasingly be supported by:
- Current product data
- Verified organisational information
- Trust evidence
- Search data
- AI observations
- Provider-selection behaviour
7. Five Levels of Financial Search Authority Maturity
- Foundation
- Developing
- Operational
- Advanced
- Leading
8. The Core Maturity Progression
The progression can be represented as:
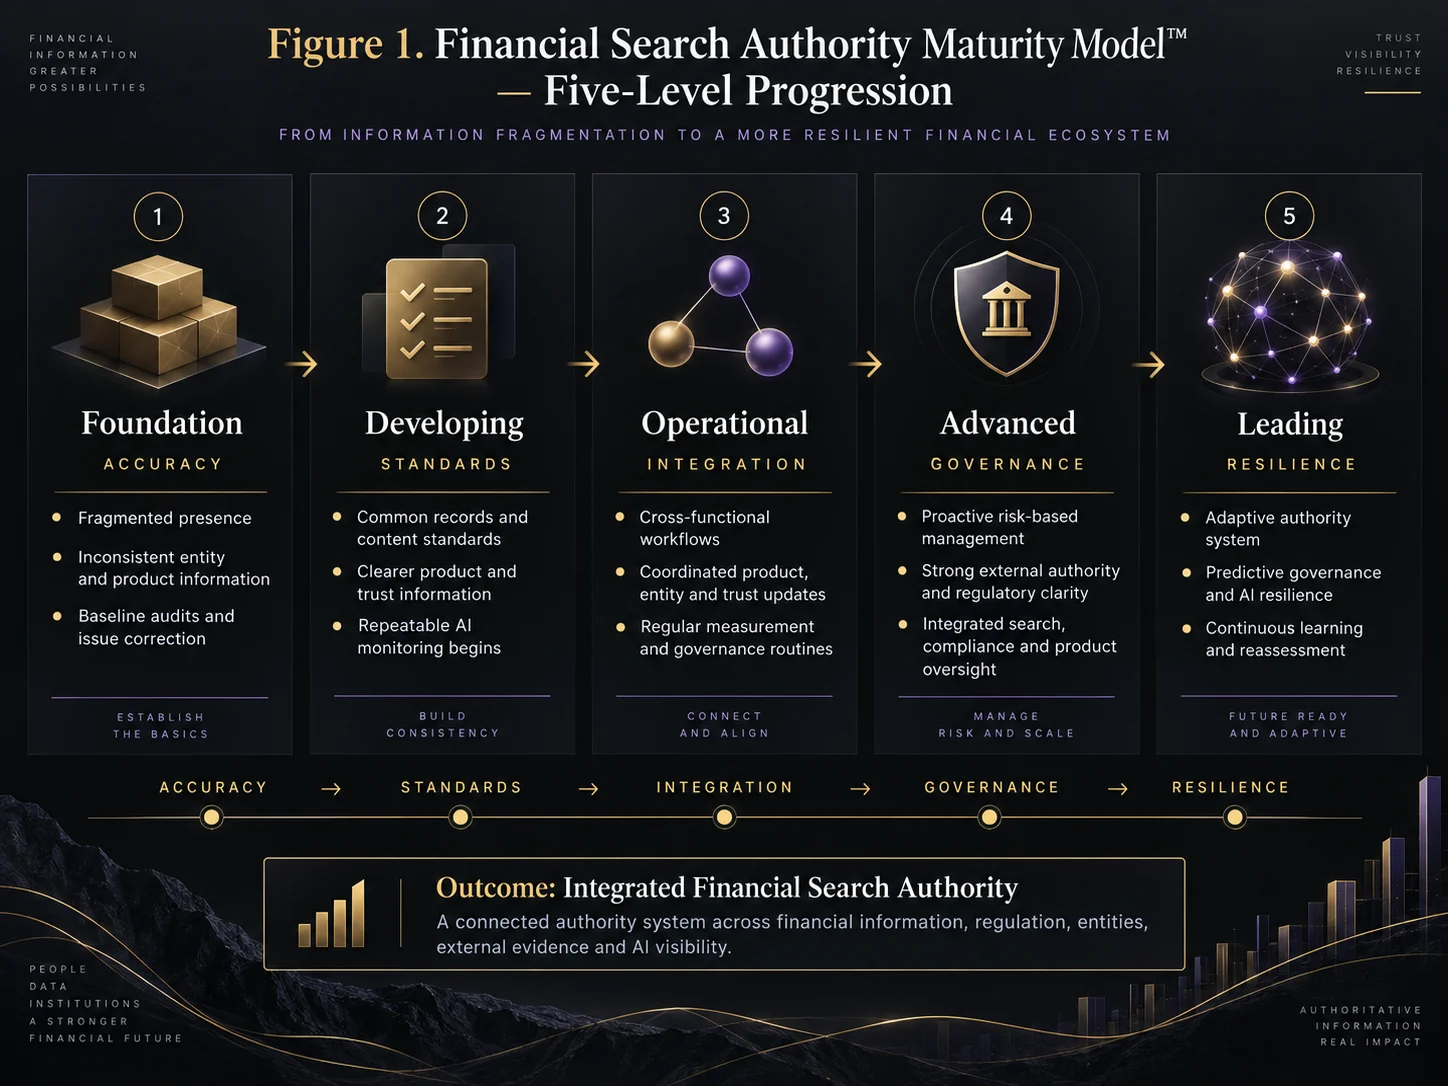
Accuracy → Standards → Integration → Governance → Resilience
9. Level One — Foundation
At Foundation maturity, the organisation has basic financial search assets but limited coordination between them.
10. Foundation Organisations May Have Basic SEO Capability
The organisation may already operate:
- A corporate website
- Product pages
- Basic organic search activity
- Branded profiles
11. Foundation Does Not Mean No Digital Presence
A provider can have substantial traffic and still remain at a low authority maturity level if its systems are fragmented or weakly governed.
12. Foundation-Level Entity Clarity
At this stage, the organisation may have incomplete or inconsistent relationships between:
- Brand
- Legal entity
- Regulated entity
- Product
- Market
13. Foundation-Level Brand Architecture
Users may encounter multiple names without a clear explanation of how those entities relate.
14. Foundation-Level Product Information
Product pages may exist but vary in:
- Depth
- Freshness
- Pricing clarity
- Eligibility detail
- Risk explanation
15. Foundation-Level Product Governance
Updates may depend heavily on individual teams or manual communication.
16. Foundation-Level Trust Evidence
Regulatory, security and customer-trust information may exist but be fragmented across the site.
17. Foundation-Level External Authority
Third-party information may be unmanaged across:
- Comparison platforms
- Directories
- Media
- Reviews
18. Foundation-Level Local Authority
Where locations matter, branch and office information may be inconsistent across search environments.
19. Foundation-Level AI Readiness
The organisation may have no formal method for monitoring AI-generated provider descriptions or recommendations.
20. Foundation-Level Measurement
Reporting may focus primarily on:
- Traffic
- Rankings
- Conversions
21. Foundation-Level Governance
There may be no shared ownership model for search authority across:
- Marketing
- Product
- Compliance
- Customer experience
- Data
22. Foundation-Level Strength
The main strength at this stage is that the provider has enough digital infrastructure to begin systematic improvement.
23. Foundation-Level Weakness
The main weakness is fragmentation.
24. Fragmentation Creates Search Risk
Different teams may publish inconsistent:
- Product terms
- Pricing
- Regulatory information
- Provider descriptions
25. Fragmentation Creates AI Risk
Machine-generated systems may encounter conflicting descriptions of the same provider or product.
26. Fragmentation Creates User Friction
Prospective customers may need additional verification before they feel confident enough to proceed.
27. Foundation-Level Priority
The first priority is not aggressive expansion.
It is establishing an accurate baseline.
28. Foundation-Level Baseline
The organisation should identify:
- Priority brands
- Legal entities
- Regulated entities
- Priority products
- Priority markets
- Priority external sources
29. Foundation-Level Entity Audit
The audit should examine whether core organisational relationships are understandable.
30. Foundation-Level Product Audit
Review whether strategic product information is:
- Accurate
- Current
- Complete
- Consistent
31. Foundation-Level Trust Audit
Review whether trust evidence around:
- Regulation
- Security
- Reputation
- Customer support
is sufficiently accessible and current.
32. Foundation-Level External Audit
Review priority third-party environments for material inaccuracies.
33. Foundation-Level AI Audit
Run a controlled baseline across:
- Brand prompts
- Product prompts
- Trust prompts
- Comparison prompts
34. Foundation-Level AI Audit Objective
The objective is not to maximise provider inclusion immediately.
It is to identify material representation errors.
35. Foundation-Level Success
A Foundation organisation begins progressing when it can answer:
- What are our key entities?
- Which products matter most?
- Where are the major conflicts?
- Which information needs correction first?
36. Foundation to Developing Transition
The transition begins when the organisation moves from ad hoc correction toward repeatable standards.
37. Level Two — Developing
At Developing maturity, the financial organisation has recognised the need for structured authority management and begins creating common standards.
38. Developing Organisations Move Beyond One-Off Fixes
Instead of correcting each issue independently, the organisation begins defining how information should be managed consistently.
39. Developing-Level Entity Standards
The organisation begins defining standard records for:
- Brand
- Legal entity
- Regulated entity
- Product
- Location
40. Developing-Level Brand Architecture
Relationships between brands and operating entities become clearer.
41. Developing-Level Product Standards
Priority product pages begin following common information requirements.
42. Product Information Standards May Include
- Purpose
- Eligibility
- Pricing
- Features
- Risk
- Restrictions
43. Developing-Level Content Standards
Financial information begins to follow more consistent editorial and review processes.
44. Developing-Level Freshness Standards
The organisation begins identifying which financial information requires more frequent review.
45. Developing-Level Pricing Governance
There may be clearer processes for updating:
- Rates
- Fees
- Offers
- Product availability
46. Developing-Level Trust Architecture
Regulatory, security and customer-trust evidence becomes easier to locate and interpret.
47. Developing-Level Regulatory Clarity
The organisation begins clarifying relationships between:
- Consumer brand
- Legal entity
- Regulated entity
- Product provider
48. Developing-Level Review Governance
The provider begins monitoring:
- Review volume
- Review recency
- Review themes
- Response patterns
49. Developing-Level External Authority
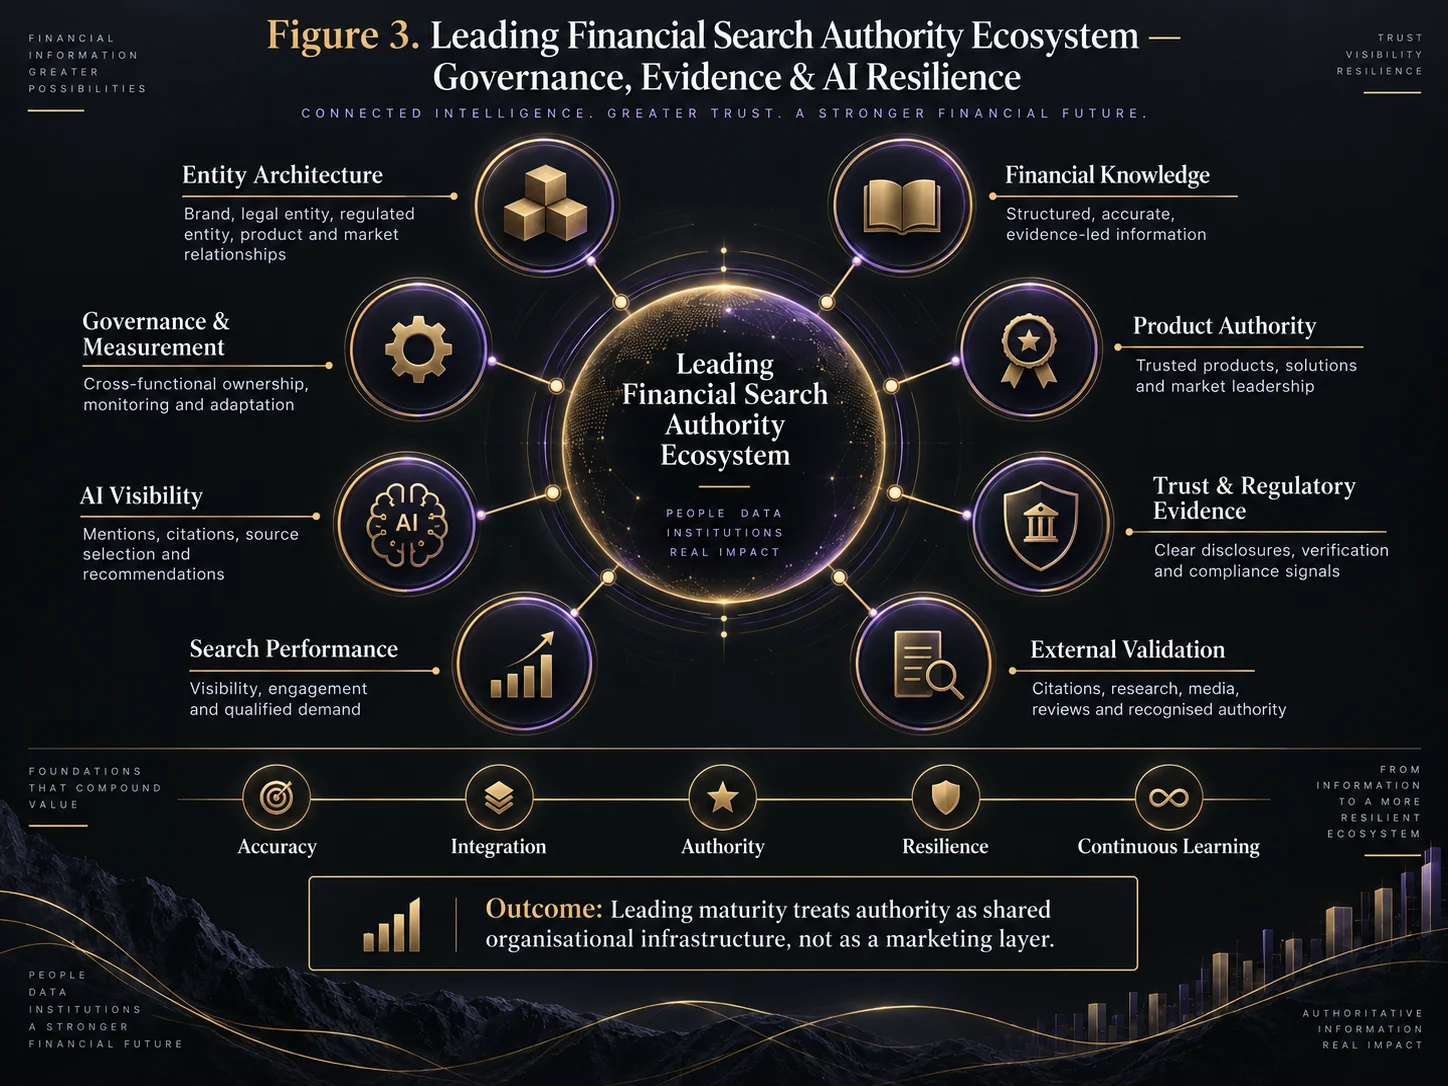
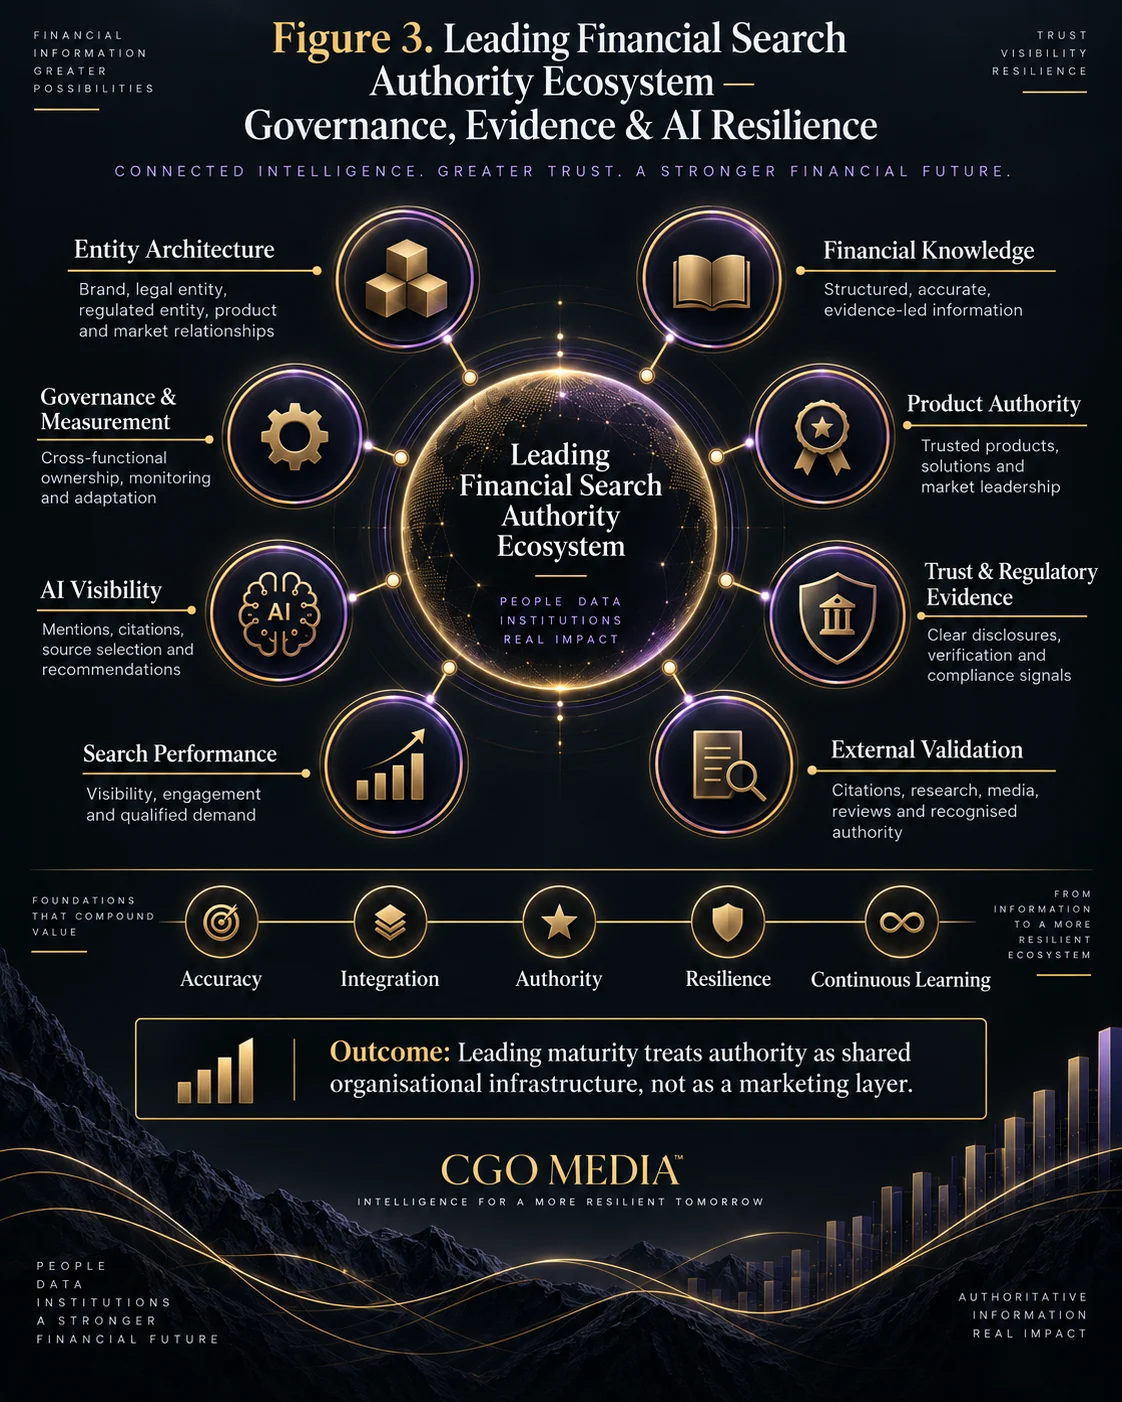
The organisation begins identifying which external sources matter most for provider discovery and validation.
50. Priority External Sources May Include
- Comparison platforms
- Regulatory sources
- Financial media
- Review platforms
- Industry directories
51. Developing-Level External Accuracy
Material third-party errors begin to be tracked and corrected systematically.
52. Developing-Level Search Architecture
Content begins to align more closely with the financial decision journey.
53. Need-to-Product Architecture
A useful structure is:
Financial Need → Product Category → Product → Provider
54. Product-to-Trust Architecture
Users should be able to progress naturally from product understanding toward relevant trust information.
55. Developing-Level Internal Linking
Internal links increasingly reflect meaningful relationships between:
- Financial guides
- Product pages
- Trust information
- Application pathways
56. Developing-Level Structured Data
Structured data may begin to reinforce visible organisational and product relationships where appropriate.
57. Structured Data Should Reflect Reality
Markup should not be used to manufacture provider authority or relationships unsupported by visible evidence.
58. Developing-Level AI Monitoring
The organisation begins running repeatable AI observations rather than occasional manual searches.
59. Developing-Level Prompt Groups
Prompt groups may include:
- Brand accuracy
- Product discovery
- Provider trust
- Provider comparisons
60. Developing-Level AI Logging
Observations may record:
- Prompt
- Model
- Date
- Provider presence
- Material accuracy
- Visible sources
61. Developing-Level AI Interpretation
The organisation begins distinguishing between:
- Provider presence
- Provider relevance
- Provider accuracy
62. Developing-Level Measurement
Reporting begins moving beyond simple rankings and traffic.
63. Developing-Level Product Visibility Measurement
Visibility may be segmented by:
- Product
- Audience
- Market
- Journey stage
64. Developing-Level Trust Measurement
The organisation may begin tracking:
- Trust-search behaviour
- Review themes
- Regulatory consistency
- Reputation patterns
65. Developing-Level Provider Selection Measurement
The provider may begin examining how users move through:
Information → Product → Provider → Trust → Comparison → Action
66. Developing-Level Governance
Responsibilities begin to become clearer across:
- Marketing
- SEO
- Product
- Compliance
- Customer experience
67. Developing-Level Ownership
Named owners may be assigned to:
- Product information
- Regulatory information
- External profiles
- AI monitoring
68. Developing-Level Review Cycles
The organisation begins defining how frequently different information types should be reviewed.
69. High-Change Financial Information
High-change areas may include:
- Rates
- Pricing
- Promotions
- Eligibility
- Product availability
70. Lower-Change Financial Information
Other information may require less frequent scheduled review but still needs change-triggered governance.
71. Developing-Level Change Triggers
The organisation begins defining triggers such as:
- Product launch
- Product withdrawal
- Pricing change
- Brand change
- Regulatory change
72. Developing-Level Strength
The organisation begins reducing authority fragmentation through shared standards.
73. Developing-Level Weakness
Standards may exist without being fully integrated into daily operations.
74. Standards Can Remain Departmental
Marketing may have one process while product, compliance and customer-service teams operate separately.
75. Data Can Remain Duplicated
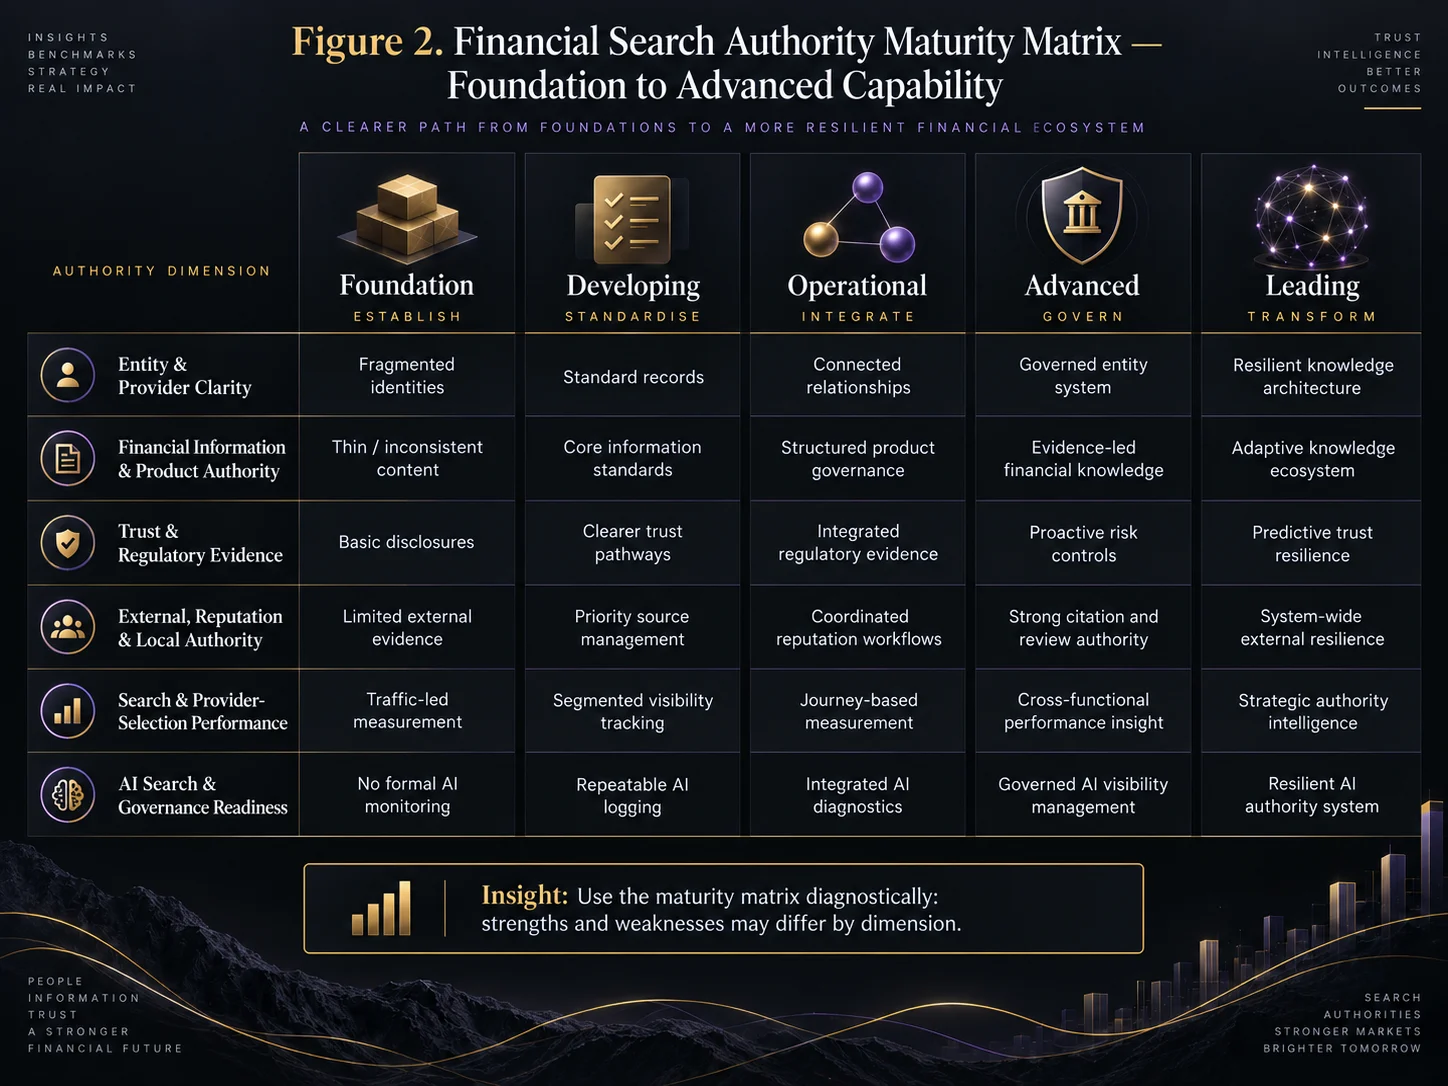
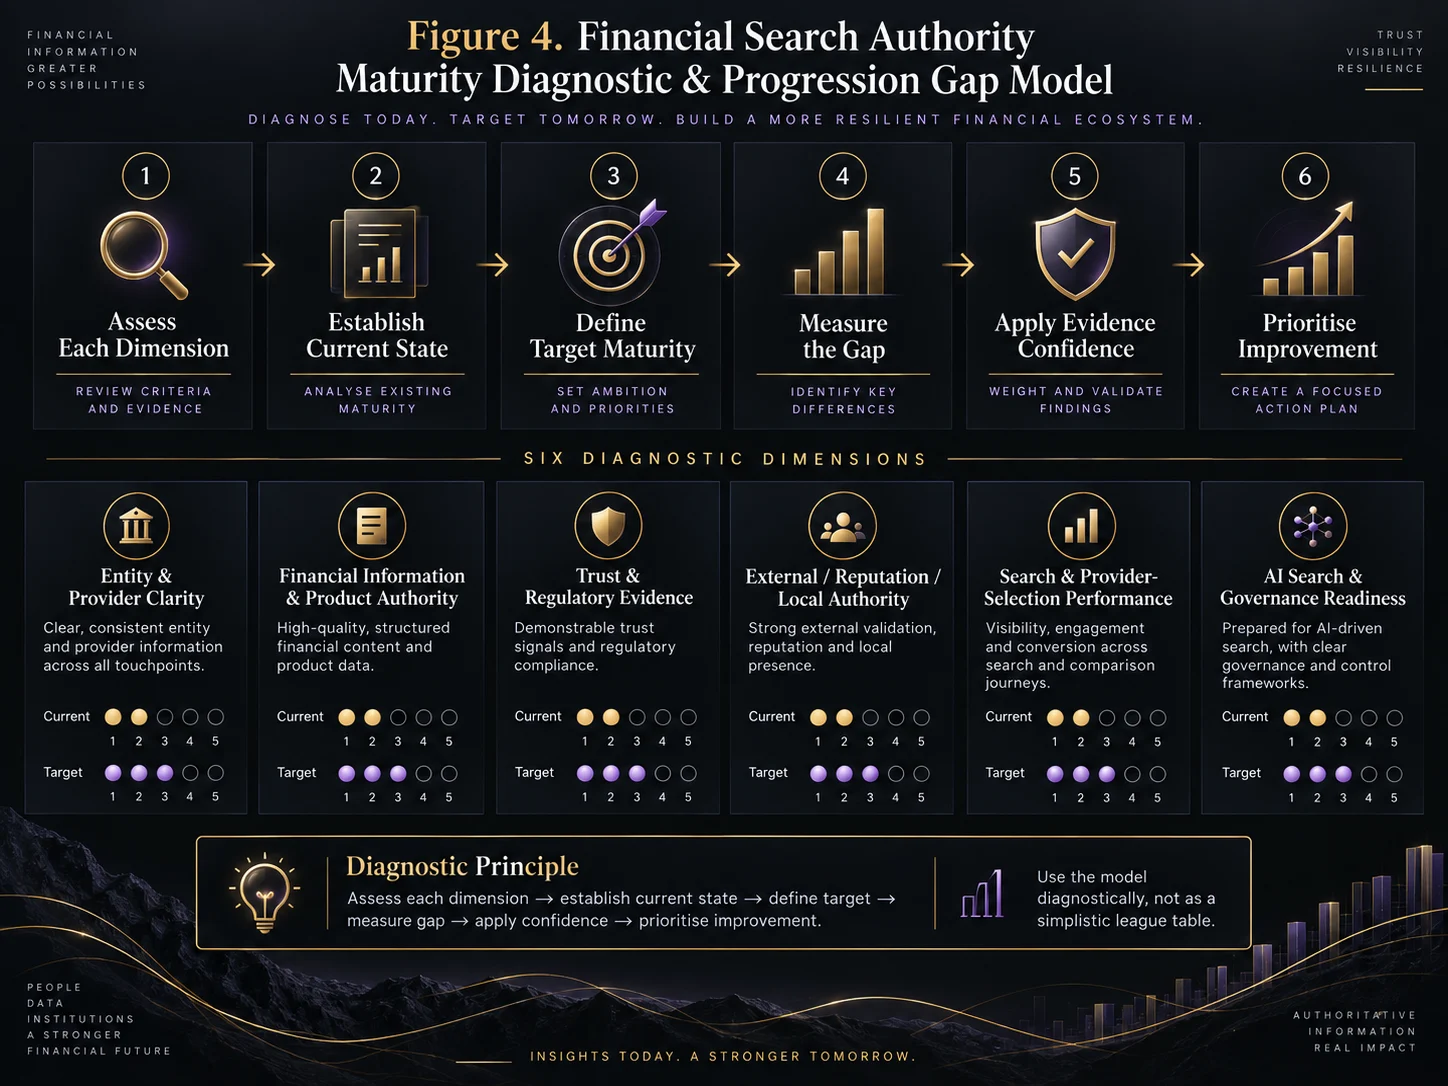
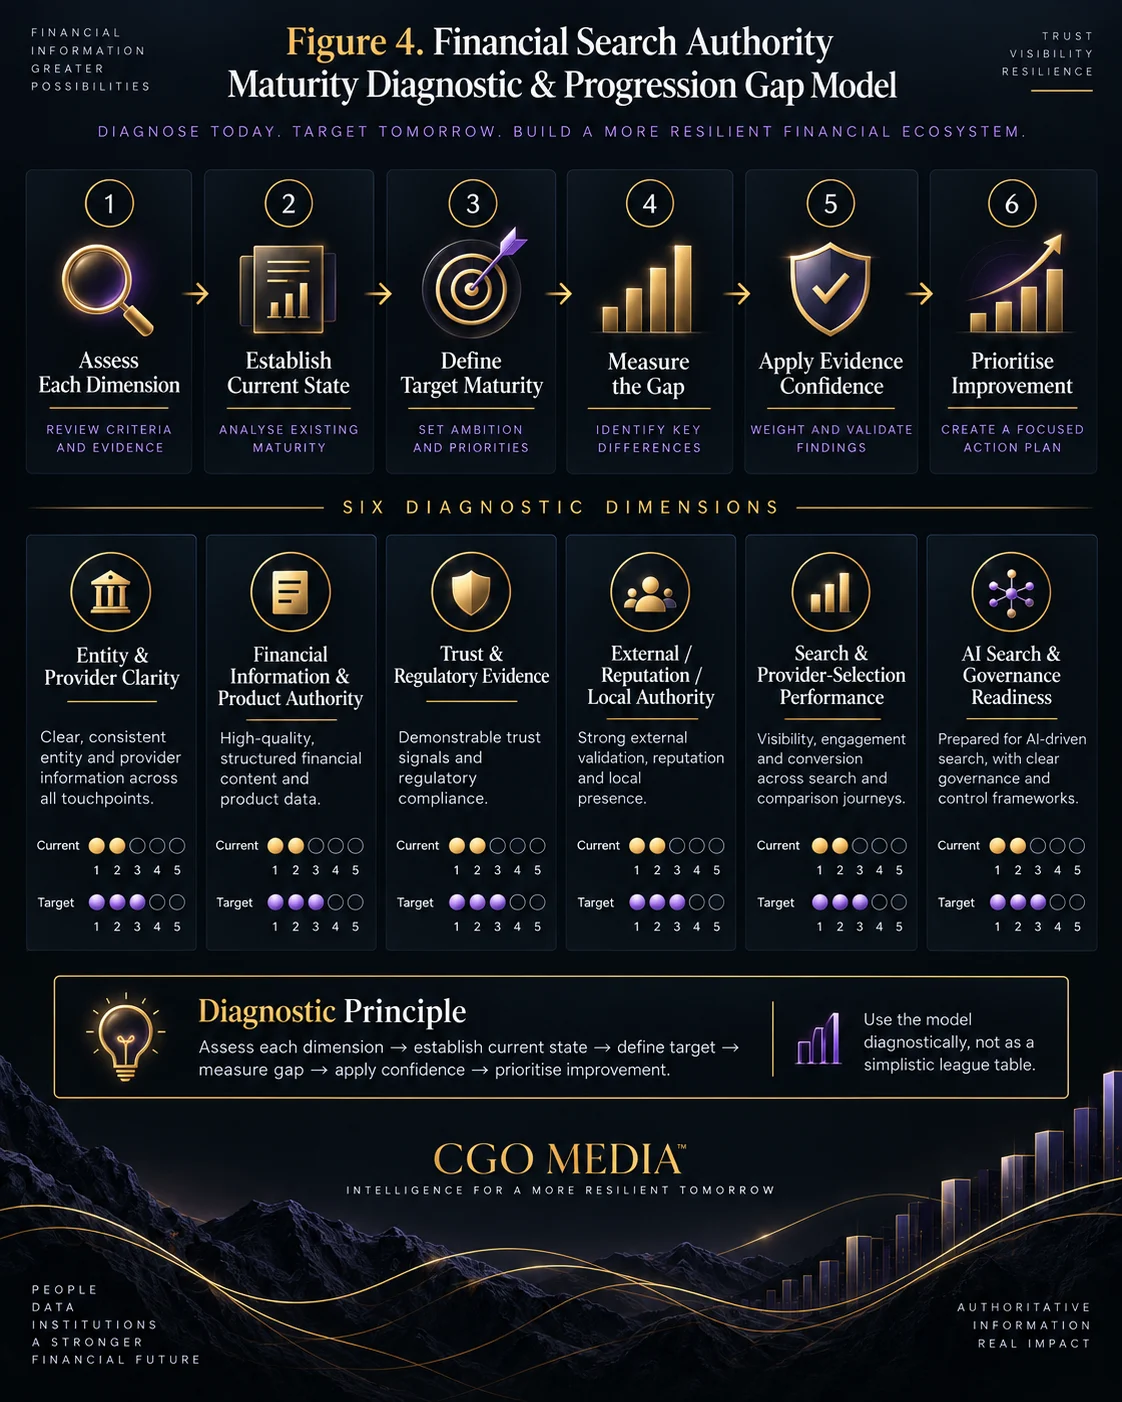
The same product or provider information may still exist across disconnected systems.
76. External Evidence Can Remain Reactive
Third-party errors may be corrected only after complaints or manual discovery.
77. AI Monitoring Can Remain Descriptive
The organisation may record generated outputs without connecting them to source, entity or product governance.
78. Developing-Level Priority
The priority is to integrate standards into repeatable operating workflows.
79. Developing-Level Success
A Developing organisation should increasingly be able to answer:
- What are our authority standards?
- Who owns each information class?
- How are product changes propagated?
- How do we monitor trust and AI representation?
80. Developing to Operational Transition
The transition occurs when standards become integrated across the organisation rather than existing primarily as guidance.
81. The First Two Levels Establish the Authority Foundation
The maturity journey begins with:
Foundation → Developing
or, operationally:
Accuracy → Standards
82. Foundation Creates the Baseline
The organisation identifies its entities, products, trust environment and critical inconsistencies.
83. Developing Creates Repeatability
The organisation introduces standards, ownership and review processes.
84. Neither Level Yet Represents Full Integration
The next maturity stage requires authority systems to become part of normal business operations.
85. Maturity Should Be Assessed Across Multiple Dimensions
A provider may be stronger in one area than another.
86. A Financial Organisation Can Have Uneven Maturity
For example:
- Strong technical SEO
- Weak product governance
- Strong brand authority
- Weak AI monitoring
87. Overall Maturity Should Not Hide Critical Weaknesses
A high average score should not compensate for severe weaknesses involving regulation, pricing or provider identity.
88. Critical Issues Override Aggregate Scores
Material trust or financial-information errors should be treated separately from overall maturity.
89. Maturity Assessment Should Include Evidence Confidence
Scores should indicate whether they are supported by:
- High-confidence evidence
- Medium-confidence evidence
- Low-confidence evidence
90. Maturity Should Be Assessed Longitudinally
The objective is not simply to obtain a score.
It is to understand whether capability is:
- Improving
- Stable
- At Risk
- Regressing
91. Maturity Should Inform Investment
Financial organisations can use the model to determine whether resources should focus on:
- Accuracy
- Structure
- Authority development
- Measurement
- Governance
92. The Next Level Is Operational Maturity
The next stage examines what happens when standards become integrated into search, product, trust, external authority, AI monitoring and governance workflows.
Figure 1 : Financial Search Authority Maturity Model — Five-Level Progression.
93. Level Three — Operational
At Operational maturity, authority standards are no longer treated mainly as guidance. They are integrated into repeatable workflows across search, product, trust, external evidence and AI monitoring.
94. Operational Maturity Means Integration
The organisation begins managing authority as part of normal business activity rather than through periodic correction projects.
95. Operational Entity Management
Core organisational relationships are documented and maintained systematically.
96. Operational Entity Architecture
The organisation can explain relationships across:
Brand → Legal Entity → Regulated Entity → Product → Market → Audience
97. Entity Relationships Are Used Operationally
These relationships influence:
- Website architecture
- Structured data
- Product templates
- External profiles
- AI diagnostics
98. Operational Product Governance
Priority financial products follow defined governance workflows.
99. Product Records Become More Structured
Important product data may include:
- Product name
- Category
- Eligibility
- Pricing
- Features
- Restrictions
- Market availability
100. Product Changes Trigger Coordinated Updates
A change to rates or terms should initiate updates across relevant controlled environments.
101. Operational Product Freshness
Review cycles reflect how quickly different product attributes change.
102. High-Volatility Product Fields
These may include:
- Interest rates
- Fees
- Promotions
- Eligibility thresholds
103. Lower-Volatility Product Fields
These may include:
- Core product purpose
- General category information
- Stable operational features
104. Operational Content Governance
Financial information has clearer:
- Owners
- Review dates
- Approval processes
- Retirement rules
105. Content Freshness Becomes Measurable
The organisation can identify which priority pages are:
- Current
- Due for review
- Overdue
- At risk
106. Operational Search Architecture
Content increasingly follows the financial decision journey rather than internal organisational structure alone.
107. Decision-Journey Architecture
A common path becomes:
Need → Product Education → Provider Discovery → Trust → Comparison → Action
108. Operational Internal Linking
Internal relationships become more intentional between:
- Guides
- Products
- Trust pages
- Comparison content
- Application pathways
109. Operational Trust Governance
Trust evidence is integrated into product and provider experiences.
110. Regulatory Information Becomes Structured
The organisation maintains clearer records of:
- Relevant legal entities
- Regulated entities
- Authorisation context
- Market-specific disclosures
111. Operational Security Evidence
Security and fraud-prevention information is maintained as part of the trust environment rather than as isolated technical content.
112. Operational Review Governance
Review monitoring becomes systematic.
113. Review Monitoring Includes Themes
The organisation analyses recurring feedback involving:
- Support
- Pricing
- Onboarding
- Claims
- Product experience
114. Operational Complaint Insight
Complaint themes are connected to product and customer-experience improvement.
115. Operational External Authority Management
Priority external sources are mapped and monitored.
116. External Source Inventory
The organisation may maintain a list of strategically important:
- Comparison platforms
- Regulatory sources
- Review platforms
- Financial media
- Industry directories
117. External Data Conflicts Become Trackable
Material inaccuracies are recorded rather than corrected informally.
118. External Correction Workflow
A useful process is:
Identify → Verify → Assign → Correct → Validate → Close
119. Operational Local Authority
Where physical locations matter, branch and office information is governed more consistently.
120. Operational Branch Data
Branch information may include:
- Address
- Opening status
- Services
- Contact information
- Market relevance
121. Operational AI Monitoring
AI observation becomes repeatable and linked to defined authority questions.
122. AI Monitoring Moves Beyond Screenshots
The organisation records structured observations over time.
123. AI Observation Dimensions
These may include:
- Presence
- Relevance
- Accuracy
- Visible sources
- Material errors
124. Operational AI Prompt Sets
Prompt groups may be segmented by:
- Brand
- Product
- Trust
- Comparison
- Audience
- Geography
125. AI Errors Are Classified by Severity
Higher-severity errors may involve:
- Regulatory identity
- Pricing
- Product availability
- Market availability
- Provider ownership
126. Operational AI Diagnosis
Persistent errors trigger investigation of the wider evidence environment.
127. Operational Measurement
The organisation measures more than rankings and traffic.
128. Operational Authority Measurement
Potential dimensions include:
- Entity clarity
- Product authority
- Trust consistency
- External authority
- AI readiness
129. Operational Provider-Selection Measurement
The organisation begins connecting search activity to the Financial Provider Selection Model.
130. Journey Measurement
Potential transitions include:
- Information to product
- Product to provider
- Provider to trust
- Trust to comparison
- Comparison to action
131. Operational Segmentation
Measurement is increasingly segmented by:
- Product
- Audience
- Market
- Acquisition source
132. Operational Evidence Confidence
Important findings begin carrying an indication of confidence.
133. Operational Ownership
Authority responsibilities are assigned more clearly across teams.
134. Product Ownership
Named teams or individuals are responsible for maintaining current product information.
135. Trust Ownership
Relevant compliance, legal, security or customer-experience teams support trust accuracy.
136. External Authority Ownership
Responsibility is assigned for important comparison, media and reputation environments.
137. AI Monitoring Ownership
A defined team manages observations and escalates material findings.
138. Operational Change Triggers
The organisation formalises events that initiate review.
139. Product Launch Trigger
A new product prompts coordinated updates across:
- Product pages
- Trust information
- Structured data
- External sources
- AI monitoring sets
140. Product Withdrawal Trigger
A withdrawn product triggers removal, redirection or archival action where appropriate.
141. Pricing Change Trigger
Rate or fee changes trigger controlled updates across relevant environments.
142. Regulatory Change Trigger
Material regulatory changes prompt review of affected provider and product information.
143. Brand Change Trigger
Rebrands or acquisitions trigger broader entity and external-source review.
144. Operational Strength
The organisation has moved from standards into repeatable integrated workflows.
145. Operational Weakness
Integration may still depend heavily on manual coordination.
146. Operational Reporting Can Remain Descriptive
The organisation may know what changed without yet predicting what is likely to weaken next.
147. Operational External Monitoring Can Remain Reactive
Third-party data issues may still be discovered after they have already influenced users.
148. Operational AI Monitoring Can Remain Observational
The organisation may identify recurring problems without yet embedding them into predictive governance.
149. Operational to Advanced Transition
The transition occurs when authority governance becomes more proactive, risk-based and data-connected.
150. Level Four — Advanced
At Advanced maturity, financial search authority is managed as a coordinated organisational system with stronger governance, analytics and early-warning capability.
151. Advanced Maturity Means Governance
The organisation moves beyond repeatable execution toward controlled authority management.
152. Advanced Entity Governance
Entity relationships are managed through authoritative sources rather than duplicated manual records where practical.
153. Advanced Source-of-Truth Architecture
The organisation identifies which systems own:
- Brand data
- Entity data
- Product data
- Location data
- Regulatory data
154. Advanced Data Propagation
Changes increasingly flow from authoritative systems into relevant digital environments through controlled processes.
155. Advanced Entity Conflict Detection
The organisation can identify discrepancies between authoritative records and published representations.
156. Advanced Product Governance
Product information is managed through more formal lifecycle controls.
157. Product Lifecycle
A mature product lifecycle may include:
Create → Approve → Publish → Monitor → Update → Withdraw → Archive
158. Advanced Product Change Management
Significant product changes initiate predefined update workflows.
159. Advanced Freshness Controls
The organisation may use:
- Automated reminders
- Change feeds
- Content-age alerts
- Pricing validation checks
160. Advanced Content Governance
Content is managed according to:
- Risk
- Strategic importance
- Change velocity
- User impact
161. High-Risk Financial Information Receives Stronger Review
Higher-risk areas may include:
- Pricing
- Eligibility
- Regulatory claims
- Risk statements
- Material product limitations
162. Advanced Trust Governance
Trust evidence is managed through coordinated controls rather than scattered disclosures.
163. Regulatory Trust Architecture
The organisation can map:
Brand → Legal Entity → Regulated Entity → Product → Market → Regulatory Evidence
164. Advanced Reputation Monitoring
Review and complaint themes are monitored for meaningful change.
165. Reputation Trend Detection
The organisation distinguishes between:
- Temporary fluctuation
- Persistent service issues
- Emerging trust risks
166. Advanced External Authority Management
External evidence is managed as part of the broader authority system.
167. External Evidence Is Prioritised by Influence
Not every third-party source receives equal monitoring effort.
168. High-Influence Sources
These may include:
- Major comparison platforms
- Relevant regulators
- Financial media
- High-visibility review environments
169. Advanced External Monitoring
The organisation can detect some material changes before they generate large-scale confusion.
170. Advanced Local Governance
Where local presence matters, location data is integrated with broader entity governance.
171. Advanced AI Monitoring
AI observations are integrated with authority diagnostics rather than managed as a separate reporting exercise.
172. AI Findings Are Connected to Evidence Classes
A material error may be classified as:
- Entity issue
- Product issue
- Trust issue
- External-source issue
- Market issue
173. Advanced AI Trend Analysis
The organisation looks for repeated patterns rather than reacting to individual outputs.
174. Advanced AI Error Recurrence Tracking
Persistent inaccuracies are tracked over time.
175. Advanced Source Pattern Analysis
Where citations are visible, the organisation can analyse which source categories recur across relevant outputs.
176. Visible Sources Are Treated as Partial Evidence
The organisation avoids assuming that visible citations fully explain model behaviour.
177. Advanced Search Measurement
Search performance is connected to:
- Product authority
- Trust
- Provider consideration
- Qualified progression
178. Advanced Provider-Selection Measurement
The organisation measures journey performance using the wider Financial Provider Selection Model.
179. Advanced Journey Diagnostics
The organisation can identify whether the main weakness lies in:
- Discovery
- Product understanding
- Trust
- Comparison
- Application
180. Advanced Bottleneck Analysis
Disproportionate loss among suitable users becomes a priority diagnostic signal.
181. Advanced Evidence Confidence
Major decisions are accompanied by an explicit confidence assessment.
182. Advanced Executive Reporting
Leadership receives a more integrated authority view.
183. Executive Reporting May Include
- Authority maturity
- Critical risks
- Product weaknesses
- Trust trends
- AI accuracy
- Journey bottlenecks
184. Advanced Governance Ownership
Authority governance becomes explicitly cross-functional.
185. Potential Governance Participants
- Marketing
- SEO
- Product
- Compliance
- Customer experience
- Technology
- Data
186. Decision Rights Become Clearer
The organisation knows who can:
- Create information
- Approve information
- Correct information
- Escalate material issues
187. Advanced Review Cycles Are Risk-Based
Review frequency varies according to:
- Change velocity
- Financial impact
- User impact
- Regulatory importance
188. Advanced Change Triggers Are Broader
Triggers may include:
- Product change
- Pricing change
- Market expansion
- Regulatory change
- Major reputation event
- Persistent AI error
189. Advanced Auditability
Material authority changes become more traceable.
190. Useful Audit Information
This may include:
- What changed
- When it changed
- Who approved it
- Why it changed
- When it was verified
191. Advanced Automation
Automation may support lower-risk monitoring tasks.
192. Appropriate Automation Examples
- Review reminders
- Content-age monitoring
- Product-data difference detection
- Broken-page detection
- External profile alerts
193. High-Risk Financial Claims Still Require Human Oversight
Automation should not independently determine material regulatory, pricing or suitability claims without appropriate verification.
194. Advanced Predictive Governance
The organisation begins anticipating likely authority failures before they become widespread.
195. Product Change Risk
High-change products can be flagged for increased monitoring.
196. Reputation Risk
Rapid changes in complaint or review patterns can trigger investigation.
197. External Data Risk
Priority third-party sources can be monitored for unexpected change.
198. AI Representation Risk
Persistent material drift can trigger deeper evidence review.
199. Advanced Strength
Authority management becomes proactive rather than mainly reactive.
200. Advanced Weakness
Even strong governance can remain vulnerable if the organisation cannot adapt quickly enough to major search, market or AI changes.
201. Advanced to Leading Transition
The transition occurs when governance develops into resilience, continuous learning and system-wide authority adaptation.
202. The Next Level Is Leading Maturity
The next stage examines the highest level of the model: an organisation capable of maintaining financial search authority through integrated evidence, predictive governance, AI resilience and continuous reassessment.
Figure 2 : Financial Search Authority Maturity Matrix — Foundation to Advanced Capability.
203. Level Five — Leading
At Leading maturity, financial search authority is managed as an integrated organisational capability with strong evidence architecture, predictive governance, cross-functional ownership and resilience across traditional search, AI-assisted discovery and provider-selection environments.
204. Leading Maturity Means Resilience
The organisation is not merely capable of operating well under stable conditions.
It can adapt when:
- Products change
- Markets change
- Regulation changes
- Search behaviour changes
- AI systems change
205. Leading Organisations Manage Authority as Infrastructure
Authority is treated as a shared information and governance system rather than as a marketing layer added after product development.
206. Leading Entity Architecture
The organisation maintains a clearer knowledge structure connecting:
Brand → Legal Entity → Regulated Entity → Product → Market → Audience → Trust Evidence → External Evidence
207. Entity Relationships Are Maintained Across Systems
Where practical, core entity information is connected across:
- Web platforms
- Product systems
- Compliance records
- Analytics
- External profiles
208. Leading Organisations Reduce Duplicate Truth
The goal is to minimise unnecessary duplication of authoritative product and entity information across disconnected systems.
209. Authoritative Data Sources Are Explicit
The organisation knows which system is authoritative for:
- Legal entities
- Product data
- Pricing
- Regulatory information
- Market availability
210. Data Lineage Becomes Important
The organisation can identify where important public-facing financial information originated.
211. Data Lineage Supports Diagnosis
When an error appears, teams can trace the underlying source rather than correcting only the visible symptom.
212. Leading Product Governance
Product authority is managed through lifecycle governance rather than one-off publishing processes.
213. Product Lifecycle Governance
A mature lifecycle may include:
Design → Approve → Launch → Monitor → Update → Withdraw → Archive
214. Product Launch Governance
New product launches trigger coordinated updates across:
- Product pages
- Search architecture
- Trust information
- Structured data
- External feeds
- AI monitoring
215. Product Change Governance
Material changes to rates, fees, eligibility or features trigger defined propagation workflows.
216. Product Withdrawal Governance
Withdrawn products are handled intentionally across:
- Website content
- Internal links
- External references
- Comparison environments
217. Product Archiving Becomes Deliberate
Historic product information is retained only where there is a clear user, legal or evidential reason.
218. Leading Content Governance
Financial content is governed according to risk, strategic value and expected change velocity.
219. Content Risk Classes
The organisation may distinguish between:
- High-risk financial content
- Medium-risk financial content
- Lower-risk educational content
220. High-Risk Content Requires Stronger Review
High-risk information may include:
- Pricing
- Eligibility
- Regulatory claims
- Risk descriptions
- Material product conditions
221. Leading Freshness Governance
Review schedules combine:
- Scheduled review
- Change-triggered review
- Automated alerts
222. Freshness Is Treated as an Authority Variable
The organisation recognises that stale information can weaken both user trust and machine interpretation.
223. Leading Trust Architecture
Trust is managed as a structured evidence system rather than a set of scattered disclosures.
224. Trust Evidence Classes
These may include:
- Regulatory evidence
- Security evidence
- Customer-service evidence
- Reputation evidence
- Operational evidence
225. Regulatory Evidence Has Defined Ownership
The organisation knows who is responsible for maintaining current regulatory information.
226. Security Evidence Has Defined Ownership
Security-related claims are maintained with appropriate technical and governance input.
227. Reputation Evidence Is Monitored Longitudinally
The organisation tracks:
- Review themes
- Complaint themes
- Service trends
- Reputation change
228. Trust Evidence Is Connected to Provider Selection
The organisation understands where users seek reassurance before comparison or action.
229. Leading External Authority Architecture
External evidence is managed as part of the financial authority system.
230. External Sources Are Prioritised by Strategic Value
The organisation distinguishes between:
- High-influence sources
- Medium-influence sources
- Low-priority sources
231. High-Influence External Sources Receive More Governance
Priority may be given to:
- Major comparison platforms
- Regulatory sources
- Financial media
- High-visibility review platforms
232. Leading External Conflict Detection
The organisation can identify when high-priority third-party information diverges materially from current internal records.
233. Leading External Correction Workflow
Material conflicts move through a defined process:
Detect → Verify → Classify → Assign → Correct → Validate → Monitor
234. Leading Local Authority Governance
Where branches or offices influence provider selection, local information is integrated into broader entity governance.
235. Local Data Is Treated as Operational Data
Location information should reflect actual service availability rather than marketing aspiration.
236. Leading AI Readiness
AI-assisted discovery is managed as one component of the broader authority environment.
237. AI Monitoring Is Integrated with Search Governance
AI observations feed into:
- Entity governance
- Product governance
- Trust governance
- External-source analysis
238. Leading AI Monitoring Uses Stable Methodology
The organisation maintains repeatable:
- Prompt groups
- Observation criteria
- Error definitions
- Reporting standards
239. AI Presence Is Not the Primary KPI
The organisation prioritises:
- Relevance
- Accuracy
- Material correctness
- Evidence quality
240. Leading AI Error Classification
Generated inaccuracies are classified according to:
- Severity
- Persistence
- User impact
- Evidence confidence
241. AI Errors Are Connected to Root Causes
A persistent issue may be traced to:
- First-party content
- External comparison data
- Old editorial information
- Conflicting entity records
- Historic product information
242. Leading AI Resilience
The organisation does not depend on one model, one prompt set or one source environment.
243. Multi-Model Observation
Where strategically important, the organisation may compare how different AI systems represent the same provider or product category.
244. Multi-Source Observation
The organisation examines whether recurring outputs are supported by similar or different source classes.
245. AI Variance Is Expected
Leading organisations do not treat every output difference as a failure.
246. Material AI Drift Is What Matters
Priority is given to persistent changes involving:
- Regulatory identity
- Pricing
- Product availability
- Provider category
- Market availability
247. Leading Search Measurement
Search performance is connected to broader authority and provider-selection outcomes.
248. Search Visibility Is Segmented Deeply
The organisation may segment by:
- Product
- Market
- Audience
- Journey stage
- Acquisition source
249. Leading Journey Measurement
The organisation uses the Financial Provider Selection Model to interpret where users are gained, retained or lost.
250. Provider-Selection Bottlenecks Are Identified
The organisation can distinguish between:
- Discovery weakness
- Product-understanding weakness
- Trust weakness
- Comparison weakness
- Application weakness
251. Qualified Progression Is Prioritised
The organisation does not seek maximum progression from every user.
It seeks stronger progression among users genuinely suited to the product.
252. Leading Evidence Confidence
Authority findings are routinely accompanied by an explicit confidence assessment.
253. Evidence Confidence Influences Action
High-confidence issues may trigger immediate action, while low-confidence findings may require additional investigation.
254. Leading Executive Reporting
Leadership receives a consolidated view of:
- Authority maturity
- Critical risks
- Product freshness
- Trust trends
- External conflicts
- AI accuracy
- Journey bottlenecks
255. Executive Reporting Separates Risk and Growth
Critical accuracy problems are not hidden within broader visibility or growth reporting.
256. Leading Governance Council
Larger financial organisations may operate a cross-functional authority governance group.
257. Potential Governance Participants
- Marketing
- SEO
- Product
- Compliance
- Customer experience
- Technology
- Analytics
258. Governance Council Purpose
The group may coordinate:
- Authority standards
- Critical risk
- Major product changes
- External conflicts
- AI representation issues
259. Leading Decision Rights
The organisation clearly defines who can:
- Create information
- Approve information
- Publish information
- Correct information
- Escalate issues
260. Leading Review Governance
Review intensity is determined by:
- Risk
- Change velocity
- User impact
- Strategic value
261. Leading Change-Trigger Governance
Change events automatically initiate relevant authority workflows.
262. Product Launch Trigger
A new product initiates review of:
- Product architecture
- Trust information
- Search coverage
- External feeds
- AI monitoring
263. Pricing Change Trigger
A rate or fee change initiates updates across all relevant controlled environments.
264. Regulatory Change Trigger
A material change prompts review of affected:
- Provider pages
- Product pages
- Trust information
- External representations
265. Brand Change Trigger
Rebrands, acquisitions or mergers initiate broader entity reconciliation.
266. Reputation Event Trigger
A major reputation event can initiate review of:
- Trust evidence
- Customer messaging
- AI representations
- External-source patterns
267. AI Drift Trigger
Persistent material generated errors initiate a structured source and evidence investigation.
268. Leading Auditability
Material changes are documented sufficiently to support:
- Review
- Diagnosis
- Accountability
- Learning
269. Leading Automation Strategy
Automation is used selectively to reduce low-value manual work.
270. Appropriate Low-Risk Automation
Examples may include:
- Content-age alerts
- Product-data differences
- Broken relationship detection
- External change alerts
- Scheduled AI observations
271. High-Risk Decisions Remain Human-Controlled
Human verification remains important for material claims involving:
- Regulation
- Pricing
- Eligibility
- Risk
- Provider identity
272. Automation Can Magnify Error
An incorrect authoritative record can propagate rapidly if automation is not governed carefully.
273. Leading Predictive Governance
The organisation uses patterns and change signals to anticipate likely authority weaknesses.
274. Product Volatility Signals
High-change products can be assigned increased monitoring intensity.
275. Reputation Change Signals
Rapid increases in specific complaint themes may trigger investigation.
276. External Conflict Signals
Unexpected third-party changes may trigger reconciliation.
277. AI Drift Signals
Repeated changes in material provider representation can trigger evidence review.
278. Search Behaviour Signals
Significant query-pattern changes may indicate a shift in how users understand or compare financial products.
279. Leading Maturity Uses Continuous Evidence
The organisation does not rely solely on periodic audits.
280. Continuous Evidence Sources
These may include:
- Search data
- Product data
- Customer feedback
- External-source monitoring
- AI observations
- Provider-selection data
281. Continuous Evidence Supports Faster Diagnosis
Emerging problems can be identified before they become widespread.
282. Continuous Evidence Supports Better Prioritisation
The organisation can focus resources on the most material weaknesses.
283. Continuous Evidence Supports Learning
Repeated patterns can improve:
- Standards
- Review cycles
- Change triggers
- Risk thresholds
284. Leading Organisations Connect Search with Product Strategy
Search behaviour can reveal:
- New financial needs
- Emerging product questions
- Comparison criteria
- Trust concerns
285. Leading Organisations Connect Search with Customer Experience
Review and complaint patterns can reveal downstream causes of future provider-selection weakness.
286. Leading Organisations Connect AI with Authority Governance
AI monitoring is treated as an evidence signal rather than a standalone optimisation discipline.
287. Leading Organisations Connect External Evidence with Internal Truth
Priority third-party sources are compared with authoritative internal records.
288. Leading Organisations Learn from Provider Selection
Loss reasons can influence:
- Product design
- Pricing
- Trust communication
- Application experience
289. Leading Maturity Is Not a Permanent State
A financial organisation can regress if governance weakens.
290. Product Complexity Can Increase
New products and markets can create authority gaps.
291. Organisational Change Can Create Regression
Acquisitions, restructuring or rebrands can introduce new conflicts.
292. Search Change Can Create Regression
New result formats or search behaviours can make established strategies less effective.
293. AI Change Can Create Regression
Model changes may alter provider representation or source patterns.
294. Mature Organisations Therefore Reassess
Leading maturity depends on continual reassessment rather than permanent certification.
295. Leading-Level Strategic Objective
The objective is to maintain a resilient authority system capable of adapting without losing:
- Accuracy
- Trust
- Evidence quality
- Governance
- Provider-selection relevance
296. The Complete Five-Level Progression
The maturity journey can now be expressed as:
Foundation → Developing → Operational → Advanced → Leading
297. The Capability Progression
Operationally, this becomes:
Accuracy → Standards → Integration → Governance → Resilience
298. Level One Establishes Accuracy
The provider identifies its critical entities, products, trust evidence and conflicts.
299. Level Two Establishes Standards
The organisation defines how important financial information should be represented and maintained.
300. Level Three Establishes Integration
The standards become embedded in repeatable operational workflows.
301. Level Four Establishes Governance
Authority management becomes more proactive, risk-based and cross-functional.
302. Level Five Establishes Resilience
The organisation continuously adapts authority systems as products, markets, search behaviour and AI systems change.
303. The Maturity Model Is Now Ready for Diagnostic Application
The next stage examines how organisations can assess maturity across different authority dimensions rather than relying only on one overall score.
Figure 3 : Leading Financial Search Authority Ecosystem — Governance, Evidence & AI Resilience.
304. Dimension-by-Dimension Maturity Assessment
A single overall maturity score can be useful for executive communication, but it may conceal important differences between authority capabilities.
305. Financial Search Authority Should Be Assessed Across Multiple Dimensions
A practical assessment can examine six connected dimensions:
- Entity and Provider Clarity
- Financial Information and Product Authority
- Trust and Regulatory Evidence
- External, Reputation and Local Authority
- Search and Provider-Selection Performance
- AI Search and Governance Readiness
306. Dimension One — Entity and Provider Clarity
This dimension assesses how clearly the organisation represents:
- Brand identity
- Legal entities
- Regulated entities
- Products
- Markets
- Locations
307. Entity Clarity at Foundation Level
Relationships between brands, entities and products may be incomplete or inconsistent.
308. Entity Clarity at Developing Level
Common naming standards and entity records begin to emerge.
309. Entity Clarity at Operational Level
Entity relationships are maintained through repeatable workflows.
310. Entity Clarity at Advanced Level
Authoritative source systems and conflict detection are increasingly used.
311. Entity Clarity at Leading Level
Entity architecture becomes resilient, traceable and integrated across internal and external environments.
312. Entity Clarity Diagnostic Questions
Assess whether the organisation can answer:
- Which entity owns each product?
- Which entity is regulated where relevant?
- Which brands belong to which legal entities?
- Which markets are served by which products?
- Which records are authoritative?
313. Entity Clarity Failure Signals
Potential signals include:
- Conflicting company names
- Unclear regulated-entity relationships
- Duplicate location records
- Incorrect product ownership
- Outdated brand references
314. Dimension Two — Financial Information and Product Authority
This dimension assesses the quality, freshness, depth and governance of financial information.
315. Product Authority at Foundation Level
Product pages may exist without consistent standards or review cycles.
316. Product Authority at Developing Level
The organisation introduces common structures for pricing, eligibility, features and risk information.
317. Product Authority at Operational Level
Product information is maintained through repeatable change and review workflows.
318. Product Authority at Advanced Level
Product lifecycle governance, risk-based review and automated freshness support become stronger.
319. Product Authority at Leading Level
Financial information becomes part of a continuously governed product and search evidence system.
320. Product Authority Diagnostic Questions
Assess whether:
- Pricing is current
- Eligibility is clear
- Product purpose is explained
- Risks are represented appropriately
- Changes propagate consistently
321. Product Authority Failure Signals
Potential signals include:
- Outdated rates
- Conflicting fees
- Missing eligibility information
- Withdrawn products still appearing
- Weak review ownership
322. Dimension Three — Trust and Regulatory Evidence
This dimension assesses whether users and search systems can validate the organisation’s legitimacy, regulatory context and operational trust.
323. Trust Maturity at Foundation Level
Trust information may exist but remain fragmented or difficult to interpret.
324. Trust Maturity at Developing Level
Regulatory, security and customer-trust information becomes more consistent.
325. Trust Maturity at Operational Level
Trust evidence is integrated into product and provider journeys.
326. Trust Maturity at Advanced Level
Trust data is governed by risk, ownership and change triggers.
327. Trust Maturity at Leading Level
Trust evidence is monitored continuously and linked to provider-selection and reputation behaviour.
328. Trust Diagnostic Questions
Assess whether:
- Regulatory identity is clear
- Security information is current
- Customer-support information is accessible
- Reviews are monitored
- Complaint themes are understood
329. Trust Failure Signals
Potential signals include:
- Ambiguous regulation
- Outdated disclosures
- Persistent reputation concerns
- Weak security communication
- Inconsistent customer-care information
330. Dimension Four — External, Reputation and Local Authority
This dimension assesses how effectively the provider is represented across influential third-party environments.
331. External Authority at Foundation Level
Third-party profiles and references may be unmanaged.
332. External Authority at Developing Level
Priority sources are identified and material errors begin to be corrected.
333. External Authority at Operational Level
External sources are monitored systematically and linked to internal ownership.
334. External Authority at Advanced Level
High-influence sources receive risk-based monitoring and conflict detection.
335. External Authority at Leading Level
External corroboration becomes an integrated component of authority governance and provider-selection strategy.
336. External Authority Diagnostic Questions
Assess whether:
- Comparison platforms are accurate
- Review profiles are current
- Financial media references are relevant
- Local records reflect operational reality
- External conflicts are tracked
337. External Authority Failure Signals
Potential signals include:
- Outdated pricing on comparison sites
- Old provider descriptions
- Duplicate branch records
- Incorrect review profiles
- Conflicting product information
338. Dimension Five — Search and Provider-Selection Performance
This dimension assesses whether authority translates into relevant discovery and qualified progression.
339. Search Performance at Foundation Level
Measurement may focus mainly on:
- Traffic
- Rankings
- Leads
340. Search Performance at Developing Level
Visibility begins to be segmented by product, market and journey stage.
341. Search Performance at Operational Level
The organisation connects search performance with product and provider-selection behaviour.
342. Search Performance at Advanced Level
Journey bottlenecks, evidence confidence and qualified conversion are measured more consistently.
343. Search Performance at Leading Level
Search, product, trust and selection data are integrated into a continuous decision system.
344. Search Performance Diagnostic Questions
Assess whether the organisation knows:
- Where users first discover the provider
- Which products generate qualified demand
- Where trust loss occurs
- Where comparison loss occurs
- Where application friction occurs
345. Search Performance Failure Signals
Potential signals include:
- High traffic with low qualified progression
- Strong rankings with weak provider trust
- High application volume with high decline rates
- Strong discovery with poor onboarding
346. Dimension Six — AI Search and Governance Readiness
This dimension assesses whether the organisation can observe, interpret, govern and improve its representation across AI-assisted discovery environments.
347. AI Readiness at Foundation Level
AI visibility may be monitored informally or not at all.
348. AI Readiness at Developing Level
The organisation introduces repeatable prompt groups and observation logging.
349. AI Readiness at Operational Level
Material errors are classified and connected to relevant source or evidence categories.
350. AI Readiness at Advanced Level
AI monitoring becomes integrated into search, product and trust governance.
351. AI Readiness at Leading Level
The organisation develops resilient, longitudinal and cross-system monitoring with clear escalation pathways.
352. AI Readiness Diagnostic Questions
Assess whether:
- Prompt groups are repeatable
- Provider descriptions are accurate
- Product information is current
- Material errors are prioritised
- Visible sources are analysed carefully
353. AI Readiness Failure Signals
Potential signals include:
- Incorrect provider categorisation
- Outdated product descriptions
- Wrong regulatory relationships
- Persistent market-availability errors
- Reactive one-off monitoring
354. Maturity Should Be Scored per Dimension
Each dimension can be assessed independently against the five-level maturity scale.
355. Five-Level Diagnostic Scale
- Foundation
- Developing
- Operational
- Advanced
- Leading
356. Uneven Maturity Is Normal
A financial organisation may be:
- Advanced in product governance
- Operational in search measurement
- Developing in external authority
- Foundation in AI governance
357. Uneven Maturity Should Be Visible
The diagnostic should show variation rather than compressing every capability into one average.
358. Maturity Gaps Create Dependency Risk
A stronger capability can be weakened by a materially weaker connected capability.
359. Strong Search with Weak Trust
A provider may rank well but lose users during verification.
360. Strong Product Authority with Weak External Accuracy
The provider’s own information may be current while comparison or review environments remain outdated.
361. Strong AI Monitoring with Weak Entity Architecture
The organisation may identify errors repeatedly without correcting their underlying cause.
362. Strong Trust with Weak Discovery
A credible provider may remain absent from relevant consideration sets.
363. Strong Discovery with Weak Application Experience
Search authority may generate demand that is lost during onboarding.
364. Maturity Assessment Should Identify the Weakest Critical Dimension
The organisation should not rely solely on the strongest or average capability.
365. Critical Dimensions May Override the Average
Severe weaknesses involving:
- Regulatory identity
- Pricing accuracy
- Product availability
- Provider identity
should remain visible regardless of the aggregate score.
366. Current State and Target State
Each dimension should record both:
- Current maturity
- Target maturity
367. Not Every Dimension Requires Leading Maturity
Target state should reflect:
- Risk
- Strategic importance
- Product complexity
- Market scale
- Available resources
368. A Small Specialist Provider May Target Advanced Capability Selectively
Not every organisation needs enterprise-level governance across every dimension.
369. A Large Multi-Market Provider May Require Higher Targets
Greater organisational complexity generally increases the need for:
- Integration
- Governance
- Automation
- Auditability
370. Define the Maturity Gap
The gap can be expressed as:
Target Maturity − Current Maturity = Progression Gap
371. Gap Size Alone Is Not Enough
A one-level gap in a critical regulatory dimension may matter more than a two-level gap in a lower-risk area.
372. Gap Priority Should Include Risk
Priority can be assessed using:
Gap Size + Risk + Strategic Importance + Evidence Confidence
373. Evidence Confidence Should Modify Interpretation
A low-confidence maturity score should not automatically trigger major investment.
374. High-Confidence Maturity Scores
These are supported by:
- Direct evidence
- Current data
- Repeatable observations
- Clear ownership
375. Medium-Confidence Maturity Scores
These may rely on:
- Partial evidence
- Sampled data
- Some inference
- Incomplete ownership records
376. Low-Confidence Maturity Scores
These may rely on:
- Sparse data
- One-off observations
- Outdated records
- Unverified assumptions
377. Low Confidence Is Itself a Maturity Signal
If an organisation cannot establish reliable evidence about its own authority systems, that information gap should be treated as a capability weakness.
378. Maturity Should Include Coverage
A process may be strong in one product line but absent elsewhere.
379. Product Coverage
Assess whether standards apply across:
- Priority products
- Secondary products
- New product launches
- Legacy products
380. Market Coverage
Assess whether maturity differs across:
- Countries
- Regions
- Local markets
- Digital-only markets
381. Audience Coverage
Assess whether authority maturity differs across:
- Consumers
- SMEs
- Enterprise customers
- Specialist audiences
382. Channel Coverage
Assess whether governance applies across:
- Website
- Search
- Comparison platforms
- Review environments
- AI systems
383. Coverage Gaps Can Create False Confidence
Strong governance in one flagship product should not be interpreted as enterprise-wide maturity.
384. Maturity Should Include Consistency
The organisation should assess whether standards are applied consistently rather than occasionally.
385. Maturity Should Include Repeatability
A capability is stronger when it can be reproduced without depending on one individual.
386. Maturity Should Include Ownership
Processes without clear ownership are more vulnerable to regression.
387. Maturity Should Include Auditability
Higher maturity generally involves greater ability to understand:
- What changed
- When it changed
- Who approved it
- Why it changed
388. Maturity Should Include Adaptability
The organisation should be able to respond when:
- Products change
- Search behaviour changes
- Regulation changes
- AI systems change
389. Diagnostic Assessment Should Produce an Improvement Portfolio
The maturity model should lead to prioritised action rather than a score alone.
390. Improvement Portfolio Categories
Actions may be grouped into:
- Critical corrections
- Foundation improvements
- Integration improvements
- Governance improvements
- Resilience improvements
391. Critical Corrections
These may include:
- Incorrect regulatory identity
- Material pricing conflicts
- Wrong product availability
- Incorrect provider ownership
392. Foundation Improvements
These may include:
- Entity inventories
- Product standards
- Trust mapping
- External-source inventories
393. Integration Improvements
These may include:
- Change workflows
- Cross-team ownership
- Structured measurement
- Provider-selection diagnostics
394. Governance Improvements
These may include:
- Risk-based review
- Decision rights
- Escalation
- Audit trails
395. Resilience Improvements
These may include:
- Predictive monitoring
- Multi-model AI observation
- External conflict detection
- Continuous reassessment
396. Progression Should Follow Dependency
An organisation should not rush toward advanced automation while basic entity and product information remains unreliable.
397. Foundation Before Automation
Reliable records are a prerequisite for dependable automation.
398. Standards Before Scale
Processes should be sufficiently clear before they are expanded across multiple products or markets.
399. Integration Before Predictive Governance
The organisation needs stable operational workflows before it can detect meaningful deviations from them.
400. Governance Before Resilience
Resilience depends on the organisation knowing what it owns, monitors and escalates.
401. Progression Is Not Always Linear
Some dimensions may advance faster than others.
402. Some Dimensions May Regress
A product launch, acquisition or regulatory change may temporarily reduce maturity in one area.
403. Regression Should Be Recorded
Maturity assessments should show when capability deteriorates rather than only when it improves.
404. Trend Should Accompany Maturity
Each dimension may be classified as:
- Improving
- Stable
- At Risk
- Regressing
405. Maturity and Trend Are Different
A high-maturity dimension can still be regressing, while a lower-maturity dimension may be improving rapidly.
406. Diagnostic Reporting Should Include Both
A useful maturity report therefore includes:
- Current level
- Target level
- Gap
- Confidence
- Coverage
- Trend
- Priority
407. Example Diagnostic Record
A dimension may be recorded as:
Product Authority — Current: Operational | Target: Advanced | Confidence: High | Trend: Improving | Priority: High
408. Another Dimension May Carry a Critical Override
For example:
Trust & Regulatory Evidence — Current: Developing | Target: Advanced | Confidence: High | Critical Issue: Regulatory identity conflict
409. Critical Overrides Should Remain Prominent
They should not disappear into an average maturity score.
410. Diagnostic Outputs Should Be Actionable
Each high-priority gap should identify:
- Owner
- Required change
- Evidence needed
- Success condition
411. The Maturity Model Supports Resource Allocation
Leadership can use diagnostic gaps to determine where investment is most likely to improve authority capability.
412. The Maturity Model Supports Sequencing
Teams can distinguish between:
- Immediate correction
- Near-term capability building
- Longer-term resilience
413. The Maturity Model Supports Governance Design
Higher-risk dimensions may require stronger:
- Ownership
- Review frequency
- Escalation
- Auditability
414. The Maturity Model Supports AI Prioritisation
AI monitoring can be focused on the provider, product and trust areas where material error would have the greatest impact.
415. The Maturity Model Supports Product Prioritisation
Strategic products can be assessed separately where authority maturity differs significantly across the portfolio.
416. The Maturity Model Supports Market Prioritisation
Multi-market providers can compare authority maturity across geographies.
417. The Maturity Model Supports Executive Communication
A structured diagnostic creates a common language for discussing authority capability across marketing, product, compliance, customer experience and leadership.
418. Dimension-Level Diagnosis Prevents Oversimplification
A provider should not be described simply as “mature” or “immature” without understanding where the strength and weakness actually sits.
419. The Diagnostic Principle
The maturity model can therefore be applied as:
Assess Each Dimension → Establish Current State → Define Target → Measure Gap → Apply Confidence → Prioritise Improvement
420. The Next Stage Is Maturity Scoring
The next section converts the diagnostic framework into a practical scoring and executive reporting system for tracking progression over time.
Figure 4 : Financial Search Authority Maturity Diagnostic & Progression Gap Model.
421. Financial Search Authority Maturity Scoring
The maturity model becomes easier to manage when each authority dimension is translated into a consistent scoring structure.
422. Use a Five-Point Maturity Scale
A practical scale is:
- Foundation
- Developing
- Operational
- Advanced
- Leading
423. Score One — Foundation
A score of 1 indicates fragmented capability, limited governance and significant dependence on manual correction.
424. Score Two — Developing
A score of 2 indicates emerging standards, clearer ownership and some repeatable processes.
425. Score Three — Operational
A score of 3 indicates integrated workflows, regular measurement and repeatable authority management.
426. Score Four — Advanced
A score of 4 indicates proactive governance, risk-based management and stronger cross-functional integration.
427. Score Five — Leading
A score of 5 indicates resilient authority systems supported by continuous evidence, predictive governance and adaptive improvement.
428. Scores Should Represent Capability, Not Activity Volume
Publishing more content, monitoring more keywords or running more AI prompts does not automatically indicate greater maturity.
429. Capability Should Be Demonstrable
A maturity score should be supported by observable evidence of:
- Standards
- Ownership
- Repeatability
- Governance
- Adaptability
430. Score Each Dimension Independently
The six dimensions should receive separate maturity scores:
- Entity and Provider Clarity
- Financial Information and Product Authority
- Trust and Regulatory Evidence
- External, Reputation and Local Authority
- Search and Provider-Selection Performance
- AI Search and Governance Readiness
431. Example Dimension Scoring
A provider might record:
- Entity and Provider Clarity — 4
- Product Authority — 3
- Trust and Regulatory Evidence — 4
- External Authority — 2
- Search Performance — 3
- AI Readiness — 2
432. The Average Score Can Provide a Summary
An average can help communicate overall capability at executive level.
433. The Average Score Should Not Replace Dimension Scores
A single average can conceal major risk.
434. Example of Average Distortion
A provider may achieve an overall score above 3 while still having a score of 1 in regulatory trust or provider identity.
435. Critical Dimensions Should Override the Average
Material weaknesses involving:
- Regulatory identity
- Pricing accuracy
- Provider identity
- Product availability
should remain prominent regardless of the aggregate score.
436. Introduce a Critical Override Flag
A maturity dashboard can therefore include a separate critical-issue indicator.
437. Example Critical Override
A provider may be recorded as:
Overall Maturity: 3.4 | Critical Override: Regulatory Entity Conflict
438. Evidence Confidence Should Accompany Every Score
A score without confidence can create false precision.
439. High Confidence
A high-confidence score is supported by:
- Direct evidence
- Current records
- Repeatable measurements
- Clear ownership
440. Medium Confidence
A medium-confidence score may rely on:
- Partial evidence
- Sampled data
- Some inference
- Incomplete documentation
441. Low Confidence
A low-confidence score may rely on:
- One-off observation
- Old documentation
- Incomplete records
- Unverified assumptions
442. Confidence Can Be Scored Separately
Organisations may choose a simple confidence scale such as:
- 1 — Low
- 2 — Medium
- 3 — High
443. Confidence Should Influence Action
A high-risk, high-confidence finding may justify immediate intervention.
444. Low-Confidence Findings May Require Investigation First
The organisation should avoid major structural change based on weak evidence where verification is possible.
445. Add Coverage to the Score
Maturity should also reflect how broadly the capability is applied.
446. Coverage Can Be Measured by Product
For example:
- 20% of priority products covered
- 60% of priority products covered
- 100% of priority products covered
447. Coverage Can Be Measured by Market
A global provider may have strong governance in one market but weak implementation elsewhere.
448. Coverage Can Be Measured by Audience
Consumer journeys may be mature while SME or enterprise journeys remain underdeveloped.
449. Coverage Can Be Measured by Channel
The organisation may be strong on its website but weak across:
- Comparison platforms
- Review environments
- AI systems
- Local profiles
450. Add Trend to the Score
Current maturity alone does not show direction of travel.
451. Suggested Trend Categories
- Improving
- Stable
- At Risk
- Regressing
452. Improving
The capability is strengthening and supporting evidence confirms progress.
453. Stable
The capability remains broadly consistent without material deterioration or improvement.
454. At Risk
Signals indicate potential deterioration if no action is taken.
455. Regressing
The capability has materially weakened compared with the previous assessment.
456. Maturity and Trend Should Be Reported Together
For example:
Product Authority — Level 4 Advanced | Trend: At Risk
457. High Maturity Can Still Require Urgent Action
A high-scoring dimension may be deteriorating because of:
- Product changes
- Governance breakdown
- External conflict
- AI drift
458. Low Maturity Can Still Show Positive Progress
A Developing capability may be improving rapidly and have strong ownership.
459. Define Current and Target Maturity
Every important dimension should record:
- Current score
- Target score
- Target rationale
460. Target Maturity Should Be Deliberate
The objective is not automatically to reach Level Five everywhere.
461. Target Maturity Depends on Risk
High-risk areas may justify higher target maturity than low-risk supporting capabilities.
462. Target Maturity Depends on Scale
A major financial institution may require more sophisticated governance than a small specialist provider.
463. Target Maturity Depends on Product Complexity
Complex or rapidly changing product portfolios may require stronger controls.
464. Target Maturity Depends on Market Complexity
Multi-market and multi-jurisdiction providers may require more advanced governance.
465. Calculate the Progression Gap
A simple gap can be calculated as:
Target Score − Current Score = Maturity Gap
466. Example Gap Calculation
If current Product Authority is 2 and target maturity is 4:
4 − 2 = 2-Level Gap
467. Gap Size Is Not the Same as Priority
A smaller gap in a critical trust dimension may deserve more attention than a larger gap in a lower-risk area.
468. Add Risk Weighting
A practical prioritisation model may consider:
Maturity Gap × Risk Weight
469. Add Strategic Weighting
Priority can be refined further using:
Maturity Gap × Risk × Strategic Importance
470. Add Evidence Confidence
A more complete decision model is:
Gap × Risk × Strategic Importance × Evidence Confidence
471. Weighted Assessment Should Remain Understandable
Complex scoring systems can create false precision if leadership cannot understand how the result was produced.
472. Use Weighting to Support Judgement
The purpose is to improve prioritisation, not replace informed decision-making.
473. Example Dimension Weighting
An organisation may decide that:
- Trust and Regulatory Evidence carries greater risk weight
- Product Authority carries high commercial weight
- AI Readiness carries medium current risk but high future strategic value
474. Weighting Should Reflect the Organisation
There is no universal weighting suitable for every financial provider.
475. Consumer Banking Weighting
A consumer bank may place greater emphasis on:
- Regulatory trust
- Product accuracy
- Customer experience
476. Investment Provider Weighting
An investment organisation may place greater emphasis on:
- Risk communication
- Regulatory evidence
- Financial information authority
477. Payments Provider Weighting
A payments provider may place greater emphasis on:
- Product clarity
- Integration
- Security
- Operational trust
478. Business Finance Weighting
A business finance provider may place greater emphasis on:
- Eligibility clarity
- Commercial fit
- Trust
- Application experience
479. Build the Executive Maturity Scorecard
Leadership should receive a compact view of authority capability.
480. Executive Scorecard Fields
Each dimension may include:
- Current level
- Target level
- Gap
- Confidence
- Trend
- Risk
- Priority
481. Example Financial Search Authority Executive Scorecard
| Authority Dimension | Current | Target | Confidence | Trend | Priority |
|---|---|---|---|---|---|
| Entity & Provider Clarity | 1–5 | 1–5 | Low / Medium / High | Improving / Stable / At Risk / Regressing | Critical / High / Medium / Low |
| Financial Information & Product Authority | 1–5 | 1–5 | Low / Medium / High | Improving / Stable / At Risk / Regressing | Critical / High / Medium / Low |
| Trust & Regulatory Evidence | 1–5 | 1–5 | Low / Medium / High | Improving / Stable / At Risk / Regressing | Critical / High / Medium / Low |
| External, Reputation & Local Authority | 1–5 | 1–5 | Low / Medium / High | Improving / Stable / At Risk / Regressing | Critical / High / Medium / Low |
| Search & Provider-Selection Performance | 1–5 | 1–5 | Low / Medium / High | Improving / Stable / At Risk / Regressing | Critical / High / Medium / Low |
| AI Search & Governance Readiness | 1–5 | 1–5 | Low / Medium / High | Improving / Stable / At Risk / Regressing | Critical / High / Medium / Low |
482. The Scorecard Should Include Critical Overrides
Critical issues should be listed separately beneath the dimension table.
483. Critical Override Examples
- Incorrect regulated entity
- Material pricing inconsistency
- Withdrawn product still marketed
- Persistent AI regulatory error
484. The Scorecard Should Include Coverage
Leadership should know whether a strong score applies across the whole portfolio or only a limited subset.
485. Example Coverage Statement
A dimension could be recorded as:
Product Authority: Level 4 Advanced | Coverage: 65% of priority products
486. The Scorecard Should Include Progress Since Last Review
A useful report should compare current results with the previous maturity assessment.
487. Measure Level Movement
For example:
- Developing → Operational
- Operational → Advanced
- Advanced → Regressing
488. Measure Gap Closure
Progress can also be expressed as a reduction in distance between current and target maturity.
489. Measure Critical-Issue Reduction
A provider may improve materially even before its maturity level changes if serious conflicts are eliminated.
490. Measure Confidence Improvement
Better evidence quality can itself represent maturity progress.
491. Measure Coverage Improvement
A previously isolated capability may become enterprise-wide over time.
492. Use Trend to Detect Early Regression
Trend indicators can reveal deterioration before a full maturity downgrade is justified.
493. Benchmarking Within the Organisation
Internal benchmarking may compare:
- Products
- Markets
- Brands
- Business units
494. Product Benchmarking
One product line may be Advanced while another remains Developing.
495. Market Benchmarking
One country may have strong trust governance while another has weaker external consistency.
496. Brand Benchmarking
Multi-brand organisations can identify where authority maturity differs by brand.
497. Business-Unit Benchmarking
Separate teams can be compared against common maturity standards.
498. External Benchmarking Requires Caution
Competitors rarely expose enough internal governance evidence to support precise maturity comparisons.
499. External Benchmarking Should Focus on Observable Evidence
Observable factors may include:
- Information clarity
- Product freshness
- Trust evidence
- External consistency
- AI representation
500. Do Not Infer Internal Maturity from Visibility Alone
A highly visible competitor may still have weak governance.
501. Do Not Infer Low Maturity from Lower Visibility Alone
A strong authority system can exist in a highly competitive market without dominating every search result.
502. Use Benchmarking to Identify Opportunity
The objective is to understand relative strengths and gaps rather than create an unsupported league table.
503. Maturity Scoring Should Influence Governance
Different scores can trigger different levels of oversight.
504. Foundation Governance Requirement
Focus on:
- Accuracy
- Basic ownership
- Critical correction
505. Developing Governance Requirement
Focus on:
- Standards
- Review cycles
- Change triggers
506. Operational Governance Requirement
Focus on:
- Integration
- Repeatability
- Cross-team coordination
507. Advanced Governance Requirement
Focus on:
- Risk-based oversight
- Auditability
- Proactive monitoring
508. Leading Governance Requirement
Focus on:
- Resilience
- Predictive governance
- Continuous reassessment
509. Maturity Scoring Should Influence Resource Allocation
Resources should be directed toward the most important gap rather than spread evenly across every authority dimension.
510. Critical-Risk Resources
Immediate resources may be required for:
- Regulatory conflicts
- Material product inaccuracies
- Provider identity errors
- High-impact trust issues
511. Foundation-Building Resources
Investment may focus on:
- Entity inventories
- Product standards
- Trust mapping
- Source-of-truth records
512. Integration Resources
Investment may focus on:
- Workflow design
- System integration
- Cross-team governance
- Measurement infrastructure
513. Advanced Governance Resources
Investment may focus on:
- Monitoring
- Auditability
- Change detection
- Risk analytics
514. Resilience Resources
Investment may focus on:
- Predictive monitoring
- Multi-model AI observation
- Continuous evidence
- Scenario planning
515. Resource Allocation Should Reflect Product Value
Strategically important products may justify greater maturity investment.
516. Resource Allocation Should Reflect Risk
High-risk financial information may require more governance even where commercial value is lower.
517. Resource Allocation Should Reflect Coverage Gaps
A mature pilot should not consume all resources while major portfolio gaps remain unresolved.
518. Resource Allocation Should Reflect Evidence Confidence
Very low-confidence areas may require diagnostic investment before major implementation investment.
519. Maturity Scoring Should Support Sequencing
A practical sequence is:
Correct Critical Weaknesses → Build Foundations → Integrate → Govern → Strengthen Resilience
520. Sequence One — Correct
Resolve material accuracy and trust problems.
521. Sequence Two — Standardise
Create consistent rules for important information classes.
522. Sequence Three — Integrate
Embed standards into normal workflows.
523. Sequence Four — Govern
Introduce risk-based controls, auditability and escalation.
524. Sequence Five — Build Resilience
Add continuous evidence, predictive monitoring and adaptive reassessment.
525. Maturity Scoring Should Support Executive Decisions
Leadership should be able to answer:
- Where are we weak?
- Where is the greatest risk?
- Where is the largest strategic gap?
- Where should investment go next?
526. Maturity Scoring Should Support Product Decisions
Product teams can identify where weak information governance may undermine discovery or comparison.
527. Maturity Scoring Should Support Compliance Decisions
Compliance teams can identify where digital representation introduces unnecessary risk.
528. Maturity Scoring Should Support Search Decisions
SEO teams can identify whether poor visibility reflects:
- Content weakness
- Entity weakness
- Trust weakness
- External inconsistency
529. Maturity Scoring Should Support AI Decisions
AI teams can identify whether representation errors are likely symptoms of deeper authority gaps.
530. The Scorecard Should Be Reviewed Periodically
Maturity scoring is most useful when repeated over time.
531. Avoid Excessive Re-Scoring
The model should not become a daily or weekly vanity metric.
532. Reassess When Meaningful Change Occurs
Useful reassessment triggers may include:
- Major product launch
- Acquisition
- Rebrand
- Regulatory change
- Market expansion
- Major AI search shift
533. Maintain a Comparable Assessment Method
Repeated maturity reviews should use sufficiently stable criteria to support longitudinal comparison.
534. Record Method Changes
If the scoring system changes materially, the organisation should document that change.
535. Use the Scorecard as a Management Tool
The objective is not to achieve a visually impressive dashboard.
It is to improve financial search authority capability.
536. The Executive Maturity Equation
A useful management view can be represented as:
Current Maturity + Evidence Confidence + Trend + Coverage + Risk + Target Gap = Authority Priority
537. The Next Stage Is Maturity Decay and Continuous Reassessment
The next section examines how financial search authority can regress, how change should trigger reassessment and how organisations can maintain maturity through a continuous improvement cycle.
Figure 5 : Financial Search Authority Maturity Scorecard & Executive Progression Dashboard.
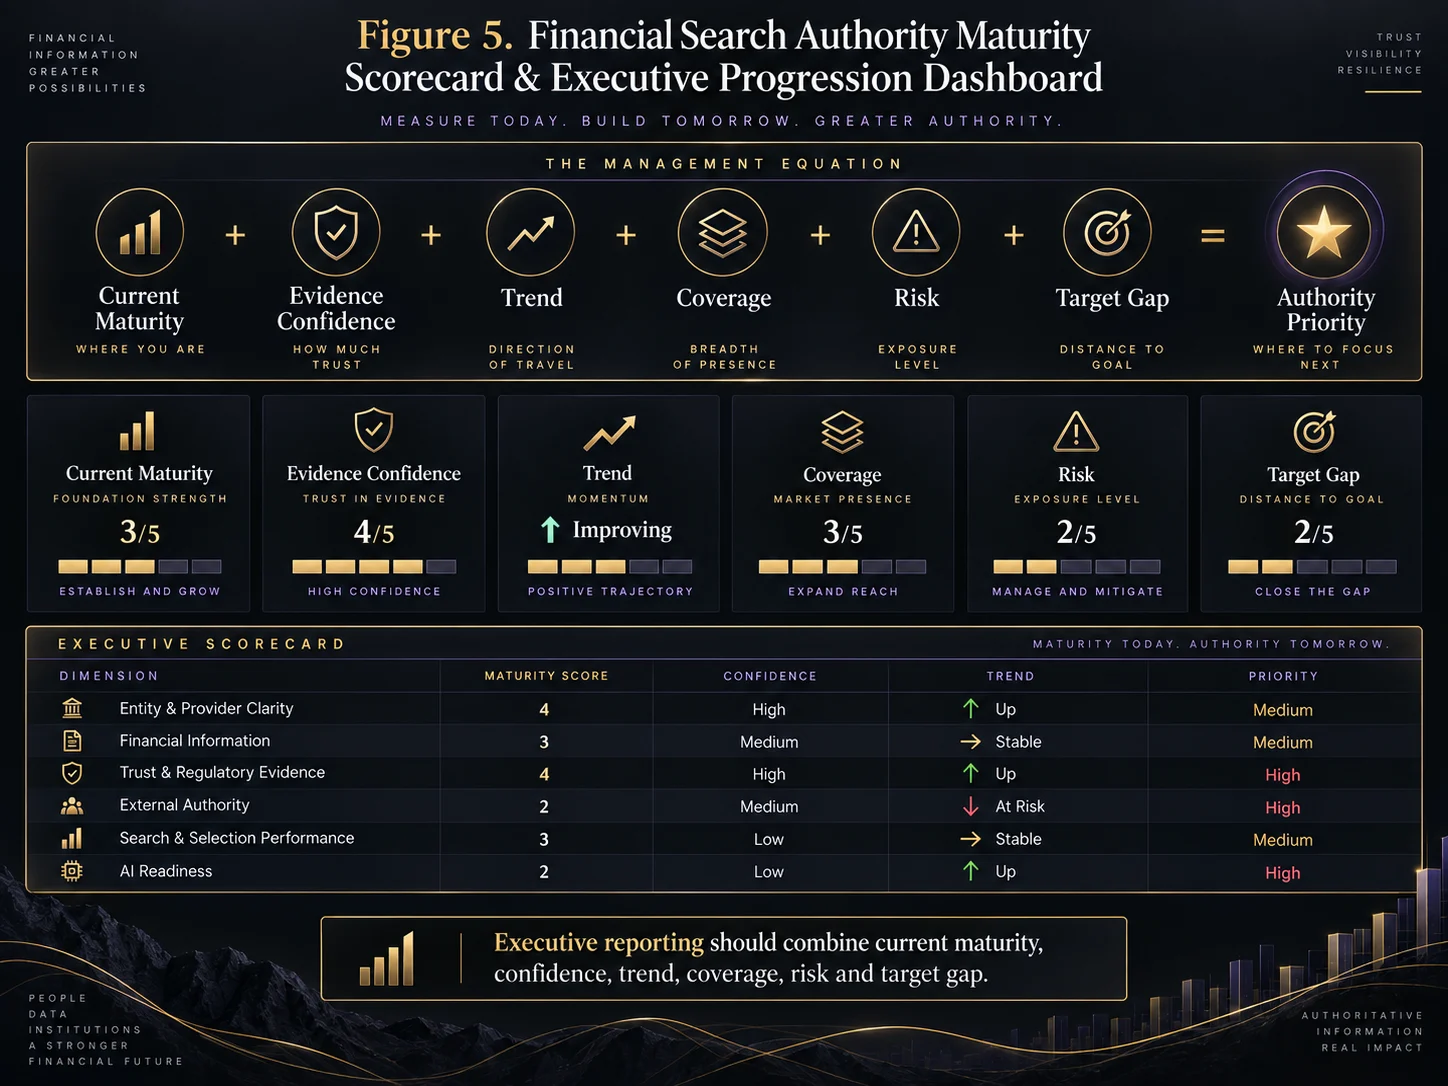
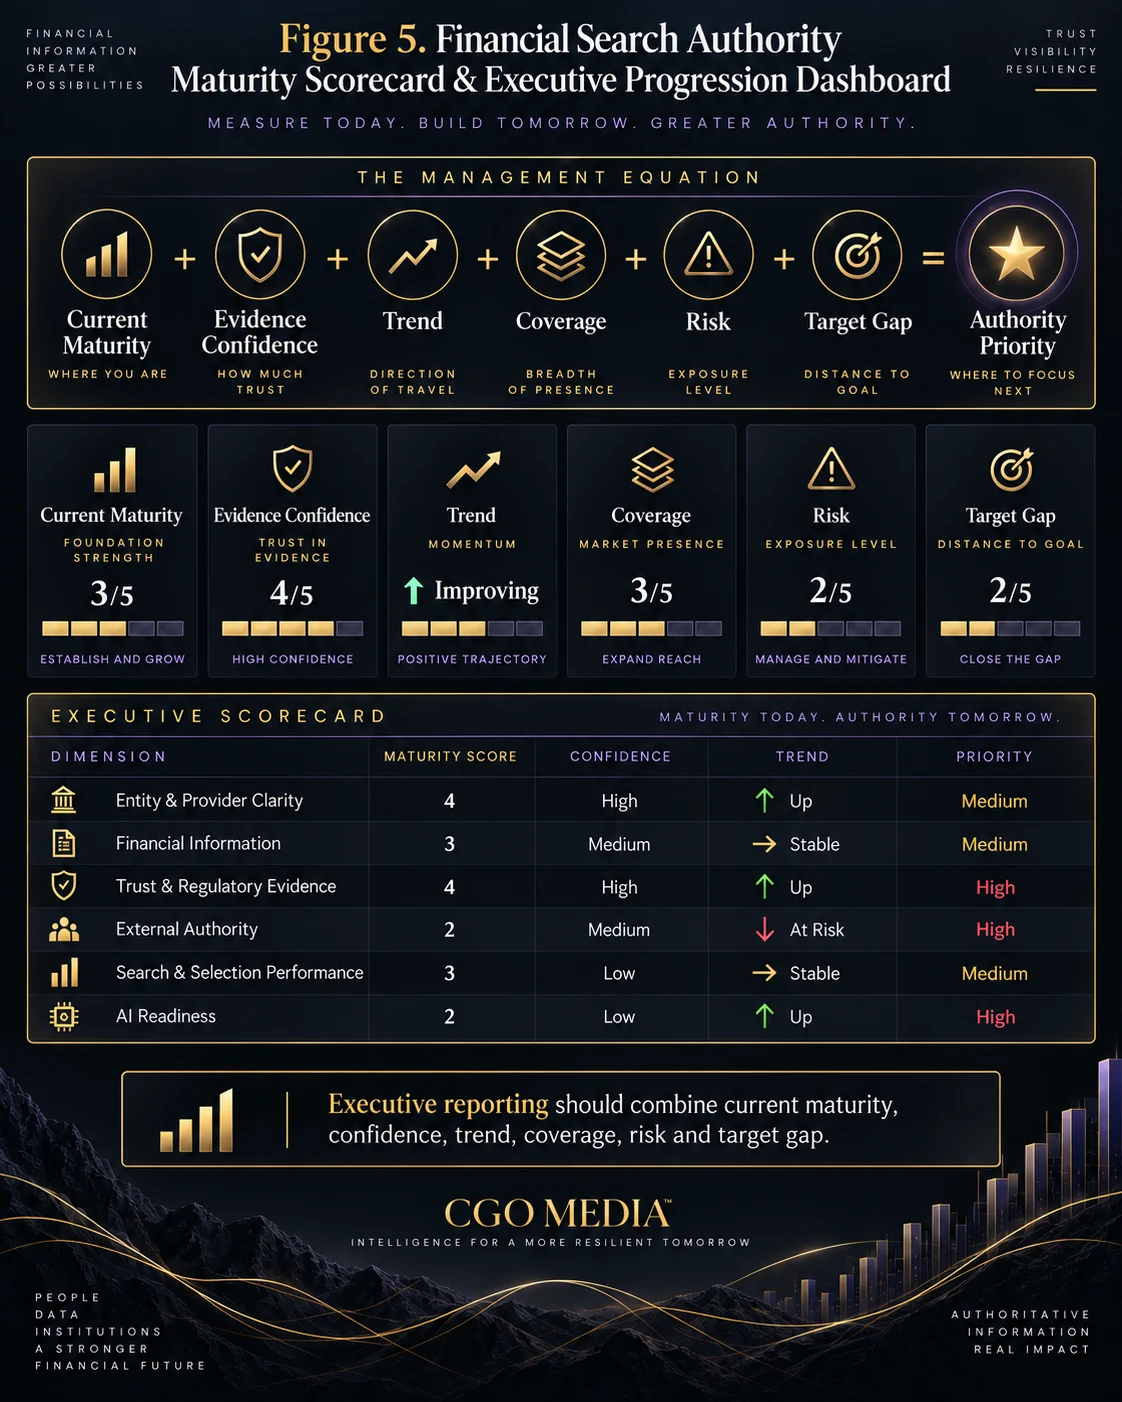
538. Financial Search Authority Can Regress
Maturity is not permanent. A financial organisation can move backwards if products, markets, governance or evidence change faster than its authority systems can adapt.
539. Regression Can Occur at Any Level
Even Advanced or Leading organisations can lose maturity when important controls weaken.
540. Product Change Can Cause Regression
Rapid changes to:
- Rates
- Fees
- Eligibility
- Features
- Product availability
can make previously accurate information unreliable.
541. Product Expansion Can Cause Regression
Launching many products quickly can create uneven standards and governance gaps.
542. Product Withdrawal Can Cause Regression
Retired products may continue to appear across:
- Search results
- Comparison platforms
- Editorial sources
- AI systems
543. Brand Change Can Cause Regression
Rebrands, mergers and acquisitions can introduce new ambiguity around:
- Brand identity
- Legal entities
- Regulated entities
- Historic product relationships
544. Market Expansion Can Cause Regression
Entering new geographies can expose weaknesses in:
- Local terminology
- Product availability
- Regulatory context
- Market-specific trust evidence
545. Organisational Restructuring Can Cause Regression
Internal change may disrupt ownership, approval and review processes.
546. Staff Turnover Can Cause Regression
Critical processes may weaken where they depend too heavily on individual memory.
547. Governance Fatigue Can Cause Regression
Review cycles may become less rigorous once the initial implementation programme is considered complete.
548. Technical Change Can Cause Regression
Website redesigns, migrations or platform changes can damage:
- Internal linking
- Structured data
- Canonicalisation
- Product discoverability
549. External Source Change Can Cause Regression
Comparison sites, directories and media sources may update information independently.
550. Reputation Change Can Cause Regression
Shifts in customer reviews or complaint themes can weaken trust.
551. Regulatory Change Can Cause Regression
Changes in rules, disclosures or provider relationships may require urgent information updates.
552. Search Behaviour Change Can Cause Regression
The organisation may remain technically strong while becoming less relevant to changing user search patterns.
553. AI System Change Can Cause Regression
Model, retrieval or citation changes may alter how providers are represented.
554. AI Regression Can Be Invisible Initially
Traditional search metrics may remain stable while AI provider representation deteriorates.
555. Maturity Decay Should Be Monitored
The organisation should look for early signs of authority weakening.
556. Entity Decay Signals
Potential indicators include:
- Brand inconsistencies
- Incorrect ownership
- Duplicate entities
- Outdated provider relationships
557. Product Decay Signals
Potential indicators include:
- Stale pricing
- Old eligibility rules
- Withdrawn products
- Conflicting product descriptions
558. Trust Decay Signals
Potential indicators include:
- Outdated disclosures
- Weak security information
- Negative review trends
- Growing complaint themes
559. External Authority Decay Signals
Potential indicators include:
- Comparison-data conflicts
- Outdated third-party descriptions
- Duplicate local records
- Reduced editorial relevance
560. Search Performance Decay Signals
Potential indicators include:
- Loss of relevant visibility
- Declining qualified traffic
- Weakening provider consideration
- Higher journey abandonment
561. AI Readiness Decay Signals
Potential indicators include:
- Incorrect provider categorisation
- Outdated product summaries
- Wrong market availability
- Persistent trust errors
562. Regression Should Trigger Reassessment
The organisation should not wait for the next scheduled annual review where material authority weakness is already visible.
563. Trigger-Based Reassessment
Useful triggers may include:
- Major product change
- Rebrand
- Acquisition
- Regulatory change
- Major reputation event
- Persistent AI error
564. Product Launch Reassessment
New products should be assessed for:
- Entity integration
- Content quality
- Trust evidence
- External accuracy
- AI representation
565. Product Withdrawal Reassessment
The organisation should verify that withdrawn products are no longer represented as current where inappropriate.
566. Acquisition Reassessment
Acquisitions should trigger review of:
- Entity architecture
- Brand relationships
- Product records
- External profiles
- AI representations
567. Market Expansion Reassessment
New markets should be evaluated against local:
- Product availability
- Regulation
- Search behaviour
- Trust expectations
568. Major Reputation Event Reassessment
Material changes in public sentiment or complaints may require a wider trust review.
569. Persistent AI Error Reassessment
Repeated high-impact inaccuracies should prompt deeper evidence analysis.
570. Maturity Failure Modes
Several recurring patterns can prevent organisations from progressing or cause them to regress.
571. Failure Mode — Treating Maturity as a Certification
The model should not be interpreted as a permanent status once achieved.
572. Failure Mode — Scoring Without Evidence
Maturity ratings should not be based solely on opinion or presentation quality.
573. Failure Mode — Scoring Activity Instead of Capability
Large content output or large keyword sets do not necessarily indicate mature authority systems.
574. Failure Mode — Averaging Away Critical Risk
Severe weaknesses should remain visible even where average maturity appears strong.
575. Failure Mode — Ignoring Coverage
A mature flagship product should not be treated as evidence of portfolio-wide maturity.
576. Failure Mode — Ignoring Confidence
Low-confidence findings should not be presented with the same certainty as well-verified evidence.
577. Failure Mode — No Target State
Scoring current maturity without defining a meaningful target produces limited strategic value.
578. Failure Mode — Targeting Level Five Everywhere
Leading maturity may be unnecessary or inefficient for lower-risk capabilities.
579. Failure Mode — Jumping Directly to Automation
Automating weak data or unclear processes can magnify errors.
580. Failure Mode — AI-First Maturity
Advanced AI monitoring cannot compensate for weak product or entity governance.
581. Failure Mode — SEO-Only Ownership
Financial search authority requires input from:
- Product
- Compliance
- Customer experience
- Technology
- Data
582. Failure Mode — Product Teams Working in Isolation
Product changes can create search and AI inaccuracies where wider digital systems are not updated.
583. Failure Mode — Compliance Working in Isolation
Accurate regulatory information may exist internally while public-facing representations remain unclear.
584. Failure Mode — Marketing Working in Isolation
Marketing teams cannot independently guarantee product accuracy, suitability or regulatory correctness.
585. Failure Mode — Ignoring External Evidence
First-party accuracy alone is insufficient where influential third-party sources remain outdated.
586. Failure Mode — Ignoring Customer Experience
Operational problems can create trust decay even where search performance initially remains strong.
587. Failure Mode — Treating Reviews as Financial Quality Scores
Review ratings may reflect service experience but should not be interpreted as proof of product suitability or regulatory strength.
588. Failure Mode — Treating AI Visibility as Authority
AI inclusion should not be used as a substitute for evidence quality.
589. Failure Mode — Treating AI Recommendation Order as Market Ranking
Generated ordering is unstable and context-dependent.
590. Failure Mode — Reacting to Every AI Variation
Teams should distinguish temporary variation from persistent material error.
591. Failure Mode — No Longitudinal Monitoring
One-time audits cannot reveal whether authority capability is improving or regressing.
592. Failure Mode — No Reassessment After Change
Major product, brand or market changes can invalidate previous maturity scores.
593. Failure Mode — No Ownership of Regression
An organisation may identify deterioration without assigning responsibility for correction.
594. Failure Mode — No Improvement Portfolio
Scoring alone does not create maturity progression.
595. Maturity Should Lead to Improvement
A practical progression cycle is required.
596. The Continuous Maturity Improvement Cycle
The model can be managed through:
Observe → Verify → Diagnose → Score → Prioritise → Improve → Govern → Measure → Learn → Reassess
597. Observe
Monitor authority evidence across the six dimensions.
598. Verify
Confirm that apparent weaknesses are genuine and current.
599. Diagnose
Identify the underlying cause of the authority gap.
600. Score
Assess current maturity, evidence confidence, trend and coverage.
601. Prioritise
Rank action using:
- Risk
- Strategic value
- Gap
- Evidence confidence
602. Improve
Strengthen the underlying capability rather than correcting only the visible symptom.
603. Govern
Embed the improved process into:
- Ownership
- Review cycles
- Change triggers
- Escalation
604. Measure
Compare the updated state against the previous baseline.
605. Learn
Use recurring patterns to improve:
- Standards
- Workflows
- Risk thresholds
- Monitoring
606. Reassess
Repeat the maturity assessment after meaningful change or on an appropriate strategic cycle.
607. Reassessment Should Be Dimension-Specific
Not every dimension needs to be rescored at the same frequency.
608. High-Change Dimensions May Need More Frequent Review
These may include:
- Product authority
- Trust evidence
- AI readiness
609. Lower-Change Dimensions May Need Less Frequent Full Review
Stable entity architecture may require less frequent comprehensive reassessment unless major change occurs.
610. Scheduled and Triggered Reassessment Should Work Together
A fixed calendar should not prevent earlier review where significant events occur.
611. Continuous Improvement Should Reduce Recurring Failure
Repeated errors should lead to stronger processes.
612. Example Pricing Regression
If stale rates repeatedly appear, the organisation should improve product-update propagation rather than correcting pages manually each time.
613. Example Entity Regression
If acquisitions repeatedly create brand confusion, merger integration should include authority governance from the outset.
614. Example External Regression
If comparison sites remain outdated, the organisation should strengthen external-source ownership and update workflows.
615. Example AI Regression
If the same generated provider error recurs, the organisation should investigate the underlying source environment and entity relationships.
616. Example Trust Regression
If complaint themes grow steadily, the issue may require operational improvement rather than more reputation content.
617. Maturity Progression Should Produce Institutional Learning
The organisation should become better at identifying authority risk before users or search systems expose it.
618. Institutional Learning Improves Standards
Recurring issues can refine:
- Product templates
- Entity rules
- Trust requirements
- AI monitoring criteria
619. Institutional Learning Improves Review Cycles
High-volatility information can receive more frequent oversight.
620. Institutional Learning Improves Change Triggers
New triggers can be added when unexpected failure patterns appear.
621. Institutional Learning Improves Resource Allocation
Investment can shift toward the authority capabilities producing the greatest risk or strategic opportunity.
622. Maturity Should Be Connected to Business Change
Authority governance should participate in:
- Product launches
- Market expansion
- Brand change
- Acquisitions
- Platform migrations
623. Maturity Should Be Connected to Search Change
Major changes in search presentation or user behaviour should prompt strategic review.
624. Maturity Should Be Connected to AI Change
Significant changes in generative search environments may alter monitoring or evidence priorities.
625. The Organisation Should Preserve Historical Assessments
Historic scores help reveal:
- Progress
- Regression
- Recurring weakness
- Successful intervention
626. Longitudinal Assessment Creates Better Context
A score of 3 has different strategic meaning if it has:
- Improved from 1
- Remained at 3 for several cycles
- Regressed from 4
627. Mature Reporting Should Explain Why Scores Changed
Leadership should understand the underlying cause of progression or regression.
628. Improvement Without Score Change Can Still Matter
The organisation may remove critical risk or improve evidence confidence before crossing into the next maturity level.
629. Score Improvement Without Capability Improvement Is Weak
The assessment should not be manipulated to create the appearance of progression.
630. Maturity Should Remain Evidence-Based
The framework is most useful when scores are supported by observable operational reality.
631. The Complete Maturity Cycle
The Financial Search Authority Maturity Model can therefore be expressed as:
Accuracy → Standards → Integration → Governance → Resilience → Reassessment
632. The Complete Operating Cycle
Its ongoing management cycle is:
Observe → Verify → Diagnose → Score → Prioritise → Improve → Govern → Measure → Learn → Reassess
633. The Long-Term Objective
The objective is to create a financial search authority system capable of remaining accurate, credible and resilient as products, customer behaviour, search systems and AI environments change.
634. The Next Step Is Final Strategic Integration
The final section will consolidate the maturity model’s strategic implications, methodology, limitations, related Financial Services frameworks and research usage guidance.
Figure 6 : Continuous Financial Search Authority Maturity Improvement Cycle.
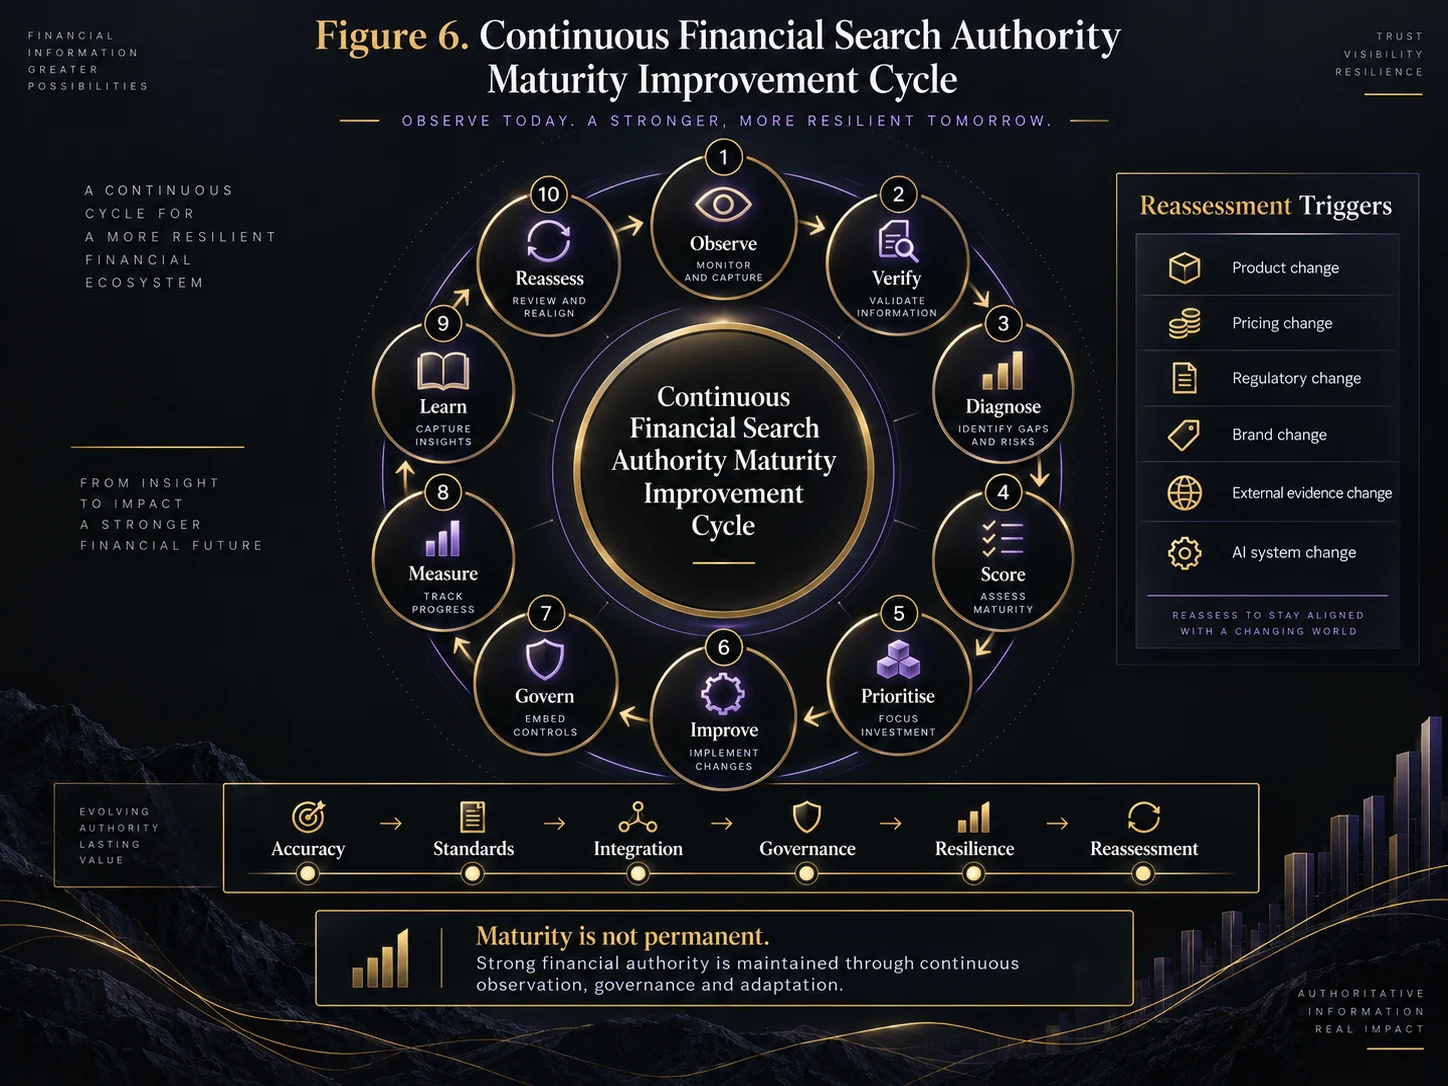
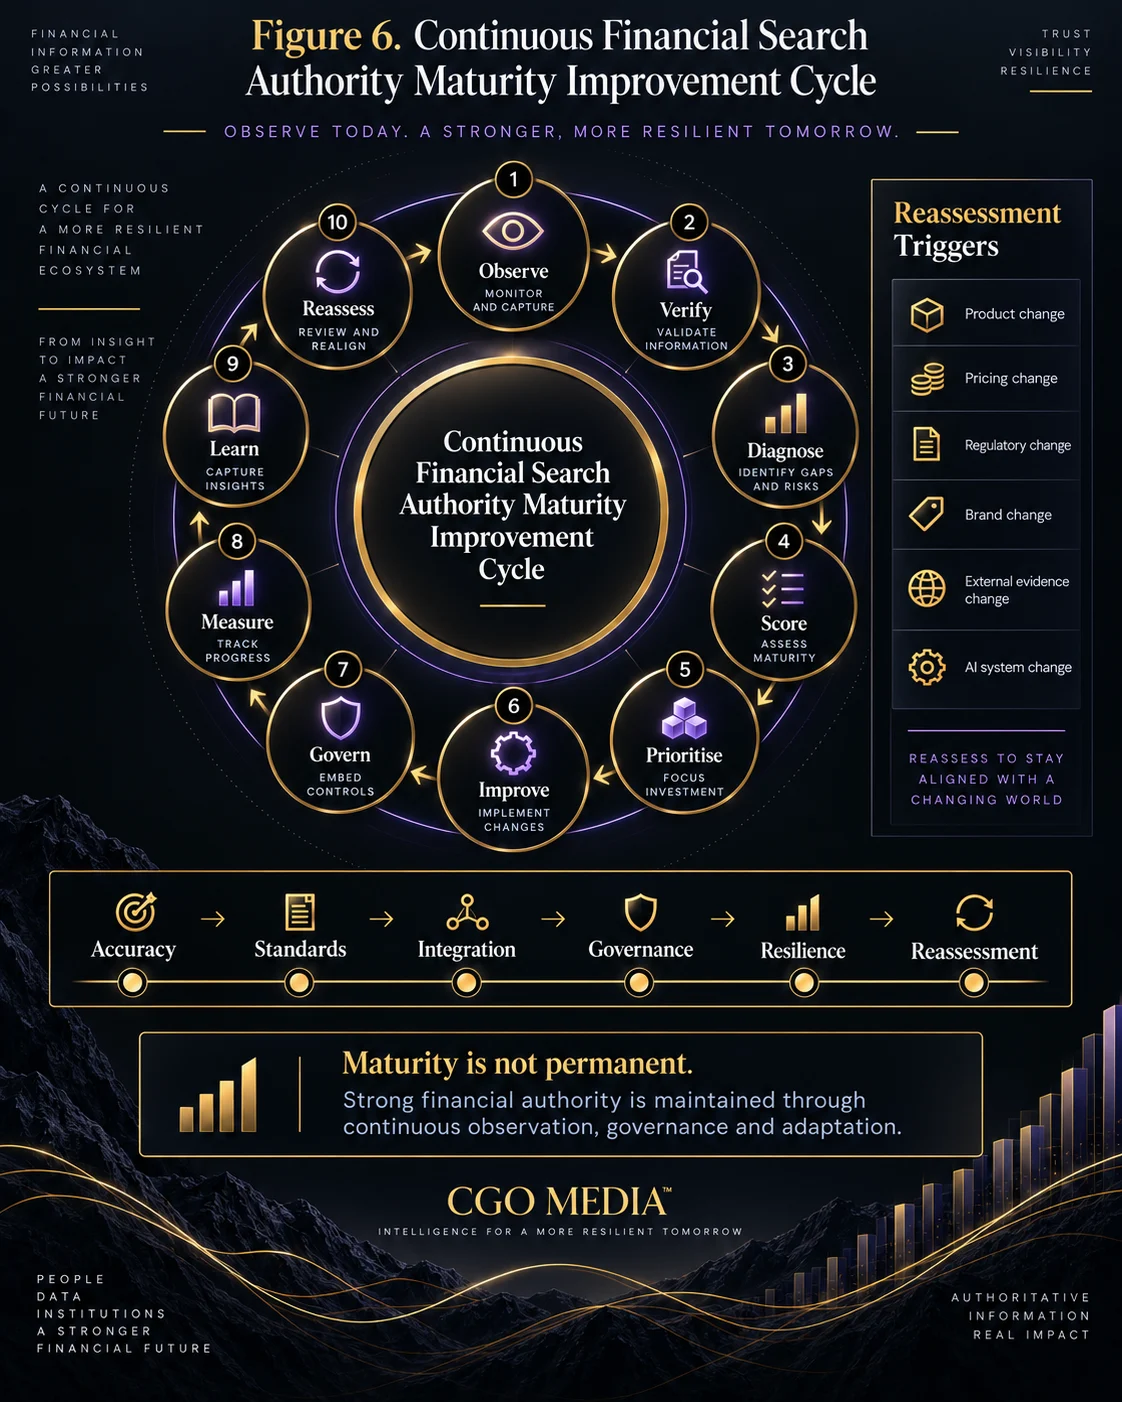
635. Strategic Implications
The Financial Search Authority Maturity Model provides a structured way to assess how effectively a financial organisation manages authority across traditional search, AI-assisted discovery, provider comparison, trust validation and digital governance.
636. Maturity Is a Capability Question
The model is not designed to reward activity volume. It evaluates whether important authority functions are accurate, repeatable, governed and resilient.
637. Authority Development Should Follow a Logical Progression
The central progression is:
Accuracy → Standards → Integration → Governance → Resilience
638. Foundation Establishes Accuracy
The organisation first needs to understand its key:
- Brands
- Legal entities
- Regulated entities
- Products
- Markets
- Trust evidence
639. Developing Establishes Standards
The organisation then defines more consistent ways to represent and maintain financial information.
640. Operational Establishes Integration
Standards become part of normal workflows across search, product, trust, external authority and AI monitoring.
641. Advanced Establishes Governance
Authority management becomes more proactive, risk-based and cross-functional.
642. Leading Establishes Resilience
The organisation develops the ability to adapt authority systems as markets, products, search behaviour and AI systems change.
643. Maturity Should Be Evaluated by Dimension
A financial provider may be strong in one authority area and weak in another.
644. Aggregate Scores Should Be Used Carefully
An overall average can support executive communication, but it should not conceal material weaknesses in areas such as:
- Regulatory identity
- Pricing accuracy
- Product availability
- Provider identity
645. Critical Overrides Protect Against False Confidence
Severe weaknesses should remain visible even where the organisation’s overall maturity score appears strong.
646. Evidence Confidence Improves Maturity Interpretation
A maturity score is more useful when leadership understands whether the evidence supporting it is:
- Low confidence
- Medium confidence
- High confidence
647. Coverage Also Matters
A strong authority process covering only one flagship product should not automatically be interpreted as organisation-wide maturity.
648. Trend Adds Direction to the Assessment
Authority dimensions should also be considered as:
- Improving
- Stable
- At Risk
- Regressing
649. Maturity Is Not Permanent
An organisation can regress following:
- Product changes
- Rebrands
- Acquisitions
- Market expansion
- Regulatory changes
- Search changes
- AI changes
650. Reassessment Is Therefore Part of the Model
The highest maturity level does not represent a permanent end state.
It represents the capability to reassess and adapt continuously.
651. Financial Search Authority Is Cross-Functional
Search authority cannot be sustained by SEO teams alone.
Relevant organisational participants may include:
Marketing + SEO + Product + Compliance + Customer Experience + Technology + Data
652. Product Teams Influence Authority
Product changes affect:
- Search accuracy
- Comparison readiness
- AI representation
- Customer expectations
653. Compliance Teams Influence Authority
Regulatory and identity information affects user trust and provider verification.
654. Customer Experience Teams Influence Authority
Service quality generates reviews, complaints and reputation evidence that can affect future provider selection.
655. Data and Technology Teams Influence Authority
Reliable data structures and propagation systems can reduce inconsistency across digital environments.
656. AI Readiness Should Not Be Treated as an Independent Discipline
Strong AI readiness depends on the quality of the same underlying evidence used across search and provider selection.
657. AI Readiness Depends on Authority Quality
A more durable model is:
Entity Clarity + Product Authority + Trust Evidence + External Corroboration + Governance = Stronger AI Readiness
658. AI Presence Is Not the Same as Maturity
Frequent appearance in generated answers does not establish that the organisation has mature authority systems.
659. AI Accuracy Is More Important Than Raw Presence
The maturity model prioritises whether AI systems represent:
- Provider identity
- Products
- Pricing
- Markets
- Regulatory relationships
accurately.
660. AI Recommendation Order Is Not a Stable Market Ranking
Provider order can vary by prompt, model, location, time and retrieval behaviour.
661. Search Authority Should Support Provider Selection
The model connects maturity with the Financial Provider Selection Model so that visibility is evaluated in the context of real decision progression.
662. Mature Authority Should Improve Qualified Discovery
The strategic objective is not maximum exposure to every user.
It is stronger visibility among users whose needs genuinely align with the provider’s products and capabilities.
663. Mature Authority Should Reduce Verification Friction
Users should be able to understand:
- Who the provider is
- What it offers
- Where it operates
- How it is regulated where relevant
- What evidence supports trust
664. Mature Authority Should Improve Organisational Learning
Recurring problems should lead to stronger standards, review cycles, change triggers and governance.
665. Mature Authority Should Become More Resilient
The organisation should become better able to maintain authority during significant internal and external change.
666. The Strategic Maturity Equation
The complete maturity logic can therefore be represented as:
Accuracy → Standards → Integration → Governance → Resilience → Reassessment
667. Relationship with the CGO Media Financial Services Research Family
The Financial Search Authority Maturity Model forms part of the wider CGO Media Financial Services research architecture.
Financial Services SEO in an AI Search Environment | Financial Services AI Trust Framework | Financial Provider Selection Model | Financial SEO & AI Implementation Roadmap
668. Relationship with Financial Services SEO in an AI Search Environment
The parent paper Financial Services SEO in an AI Search Environment establishes the broader research context for financial search, AI-assisted discovery, trust, entity authority and provider visibility.
669. Relationship with the Financial Services AI Trust Framework
The Financial Services AI Trust Framework provides the trust architecture underlying several dimensions of the maturity model.
670. Relationship with the Financial Provider Selection Model
The Financial Provider Selection Model explains how users move from financial need recognition through provider discovery, trust validation, comparison and final selection.
671. Relationship with the Financial SEO & AI Implementation Roadmap
The Financial SEO & AI Implementation Roadmap translates maturity findings into practical implementation priorities and operational workstreams.
672. Methodology
The Financial Search Authority Maturity Model is a conceptual research framework developed by CGO Media to help financial organisations assess, compare and improve their capability across search, trust, provider selection and AI-assisted discovery environments.
673. Five Primary Maturity Levels
- Foundation
- Developing
- Operational
- Advanced
- Leading
674. Foundation Method
Foundation assessment focuses on identifying:
- Critical entities
- Priority products
- Trust evidence
- External conflicts
- AI representation errors
675. Developing Method
Developing assessment examines whether the organisation has created common standards, ownership and review processes.
676. Operational Method
Operational assessment examines whether standards are integrated into repeatable business workflows.
677. Advanced Method
Advanced assessment examines whether governance is:
- Risk-based
- Proactive
- Cross-functional
- Auditable
678. Leading Method
Leading assessment examines whether the organisation demonstrates:
- Resilience
- Continuous evidence
- Predictive governance
- Adaptive reassessment
679. Six Assessment Dimensions
The maturity model assesses:
- Entity and Provider Clarity
- Financial Information and Product Authority
- Trust and Regulatory Evidence
- External, Reputation and Local Authority
- Search and Provider-Selection Performance
- AI Search and Governance Readiness
680. Dimension Scoring Method
Each dimension may be scored independently from 1 to 5.
681. Current and Target State
The assessment records:
- Current maturity
- Target maturity
- Progression gap
682. Evidence Confidence Method
Findings may be classified as:
- Low confidence
- Medium confidence
- High confidence
683. Coverage Method
The assessment may consider how broadly a capability applies across:
- Products
- Markets
- Audiences
- Channels
684. Trend Method
Each dimension may be classified as:
- Improving
- Stable
- At Risk
- Regressing
685. Critical Override Method
Material risks may be highlighted separately from aggregate maturity scores.
686. Prioritisation Method
Improvement priority may be informed by:
Maturity Gap + Risk + Strategic Importance + Evidence Confidence
687. Reassessment Method
The framework supports both:
- Scheduled reassessment
- Change-triggered reassessment
688. Continuous Improvement Method
The maturity-management cycle is:
Observe → Verify → Diagnose → Score → Prioritise → Improve → Govern → Measure → Learn → Reassess
689. Limitations
The Financial Search Authority Maturity Model is a conceptual research and management framework. It is not a regulatory certification, financial-services compliance standard, audit opinion or legal determination.
690. Maturity Scoring Contains Judgement
Although evidence can improve consistency, some assessment criteria require informed interpretation.
691. No Universal Weighting Exists
The appropriate weighting of authority dimensions varies according to:
- Provider type
- Product
- Market
- Risk
- Organisational scale
692. Not Every Organisation Requires Level Five Everywhere
Target maturity should remain proportionate to business need and risk.
693. External Maturity Is Difficult to Observe Fully
Competitors do not normally disclose enough internal governance information to support precise external maturity scoring.
694. Search Performance Does Not Equal Maturity
Strong rankings or traffic do not prove strong governance or authority resilience.
695. Low Visibility Does Not Automatically Mean Low Maturity
Competitive market conditions can affect visibility even where internal authority systems are strong.
696. Review Evidence Has Limitations
Customer reviews may provide useful experience evidence but do not establish product suitability, regulatory strength or financial quality.
697. Attribution Has Limitations
Financial journeys may involve offline referrals, multiple devices, comparison platforms and closed AI environments that are difficult to measure completely.
698. AI Observation Has Limitations
Generated outputs may vary by:
- Model
- Prompt
- Location
- Time
- Retrieval process
699. Visible AI Sources May Be Incomplete
Displayed citations should not be assumed to represent every source or signal involved in a generated answer.
700. AI Source Appearance Does Not Establish Full Causation
A visible source should not automatically be treated as the sole cause of provider inclusion or description.
701. AI Provider Inclusion Is Not Endorsement
Appearance in a generated response does not constitute independent financial validation, regulatory approval or suitability advice.
702. AI Recommendation Order Is Not a Stable Ranking
Provider sequence may vary and should not be treated as a permanent market hierarchy.
703. The Maturity Model Does Not Guarantee Search Rankings
Higher maturity may strengthen search authority capability but does not guarantee a particular ranking position.
704. The Maturity Model Does Not Guarantee AI Inclusion
No maturity level guarantees citation, recommendation or inclusion by any particular AI system.
705. The Maturity Model Does Not Determine Product Suitability
Financial product suitability depends on individual or organisational circumstances and may require appropriate regulated or professional advice.
706. Conclusion
Financial search authority is becoming increasingly difficult to manage as one-dimensional SEO.
Provider visibility now operates across search engines, AI assistants, comparison platforms, regulatory sources, reviews, financial media and customer-generated reputation evidence.
Financial organisations therefore need stronger systems for maintaining accurate entities, current product information, verifiable trust evidence, coherent external representations and reliable AI-search governance.
The Financial Search Authority Maturity Model provides a five-level structure for evaluating how effectively those capabilities have developed.
Its central maturity progression is:
Foundation → Developing → Operational → Advanced → Leading
Its underlying organisational progression is:
Accuracy → Standards → Integration → Governance → Resilience → Reassessment
The objective is not simply to reach a higher score. It is to build an authority system capable of remaining accurate, useful and credible as financial products, markets, search behaviour and AI-assisted discovery continue to change.
References
External Academic, Technical and Search Sources
- Google Search Central. SEO Starter Guide.
- Google Search Central. Understand how structured data works.
- Schema.org. FinancialService.
- Schema.org. Organization.
- Hogan, A. et al. (2021). Knowledge Graphs. ACM Computing Surveys, 54(4).
- Metzger, M.J. (2007). Making Sense of Credibility on the Web: Models for Evaluating Online Information and Recommendations for Future Research. Journal of the American Society for Information Science and Technology, 58(13), 2078–2091.
- Ji, Z. et al. (2023). Survey of Hallucination in Natural Language Generation. ACM Computing Surveys, 55(12).
CGO Media Financial Services Research and Frameworks
- Wilkinson, R. (2026). Financial Services SEO in an AI Search Environment. CGO Media.
- Wilkinson, R. (2026). Financial Services AI Trust Framework. CGO Media.
- Wilkinson, R. (2026). Financial Provider Selection Model. CGO Media.
- Wilkinson, R. (2026). Financial SEO & AI Implementation Roadmap. CGO Media.
- Wilkinson, R. (2026). Financial GEO: Generative Engine Optimisation CGO Media.
CGO Media Research Ecosystem
CGO Media Research Library | CGO Media Framework Library | CGO Media Research Architecture
About Roger Wilkinson
Roger Wilkinson is an independent researcher, SEO practitioner and founder of CGO Media with more than 25 years of experience in search, digital visibility and business growth.
His research focuses on how artificial intelligence is reshaping search engines, recommendation systems, entity representation, digital authority and organisational visibility.
Roger is the creator of the CGO Framework Series, a collection of research-led methodologies designed to help organisations measure, improve and govern Search Visibility, AI Visibility and Digital Authority.
His work examines the relationship between Technical SEO, Entity Authority, Content Authority, Citation Authority, Brand Signals, Knowledge Architecture and AI Search Readiness.
View Roger Wilkinson’s researcher profile →
Related Financial Services Research and Frameworks
Financial Services SEO in an AI Search Environment |
Financial Services AI Trust Framework |
Financial Provider Selection Model |
Financial SEO & AI Implementation Roadmap |
Financial GEO: Generative Engine Optimisation
Research Usage & Citation
CGO Media encourages researchers, journalists, financial organisations, educators, analysts and professional-services firms to reference this model where it contributes to wider discussion and understanding of financial search authority, AI readiness, trust governance and digital maturity.
Reasonable quotations, summaries, figures and excerpts may be used in articles, reports, presentations, academic work and other publications provided appropriate acknowledgement is given to Roger Wilkinson and CGO Media.
Cite This Framework / Embed Citation
The Financial Search Authority Maturity Model by Roger Wilkinson at CGO Media provides a five-level framework for assessing how financial organisations progress from fragmented search foundations through standardisation, integration, governance and resilient AI-search authority.
APA Citation
APA Citation: Wilkinson, R. (2026). Financial Search Authority Maturity Model. CGO Media. https://cgomedia.com/financial-search-authority-maturity-model/
Author: Roger Wilkinson | Published by: CGO Media
For permissions relating to extensive reproduction, commercial licensing or republication of substantial portions of this framework, please contact CGO Media directly.