
Financial Provider Selection Model
 The Financial Provider Selection Model explains how consumers and businesses can move from an initial financial need through information discovery, product understanding, provider discovery, trust validation, comparison and eventual selection of an appropriate financial organisation.
The model forms part of the wider CGO Media Financial Services research architecture and should be read alongside Financial Services SEO in an AI Search Environment, the Financial Services AI Trust Framework, the Financial Search Authority Maturity Model and the Financial SEO & AI Implementation Roadmap.
The model treats financial search as a decision journey rather than a single search, ranking or conversion event. Users may move repeatedly between search engines, AI assistants, comparison platforms, provider websites, regulatory sources, financial media, reviews and professional recommendations before taking action.
1. Purpose of the Financial Provider Selection Model
The purpose of the model is to explain how financial visibility develops into consideration, confidence, comparison and provider selection.
2. Financial Search Begins with a Need
Many financial journeys begin before the user has identified a specific product or provider.
3. The Initial Trigger May Be a Problem
A consumer or business may begin with a problem such as:
- Insufficient cash flow
- High borrowing costs
- Need for insurance protection
- Difficulty accepting payments
- Need to save or invest
- Need to purchase property
4. The Initial Trigger May Be an Objective
Other journeys begin with a goal such as:
- Buying a home
- Building savings
- Planning retirement
- Expanding a business
- Reducing financial risk
- Improving payment infrastructure
5. Provider Demand Often Emerges Later
At the earliest stage, users may not yet know which product category or provider type is appropriate.
6. Financial SEO Should Therefore Cover the Full Decision Journey
Visibility around direct product keywords alone may miss the earlier information and problem-recognition stages that shape provider consideration.
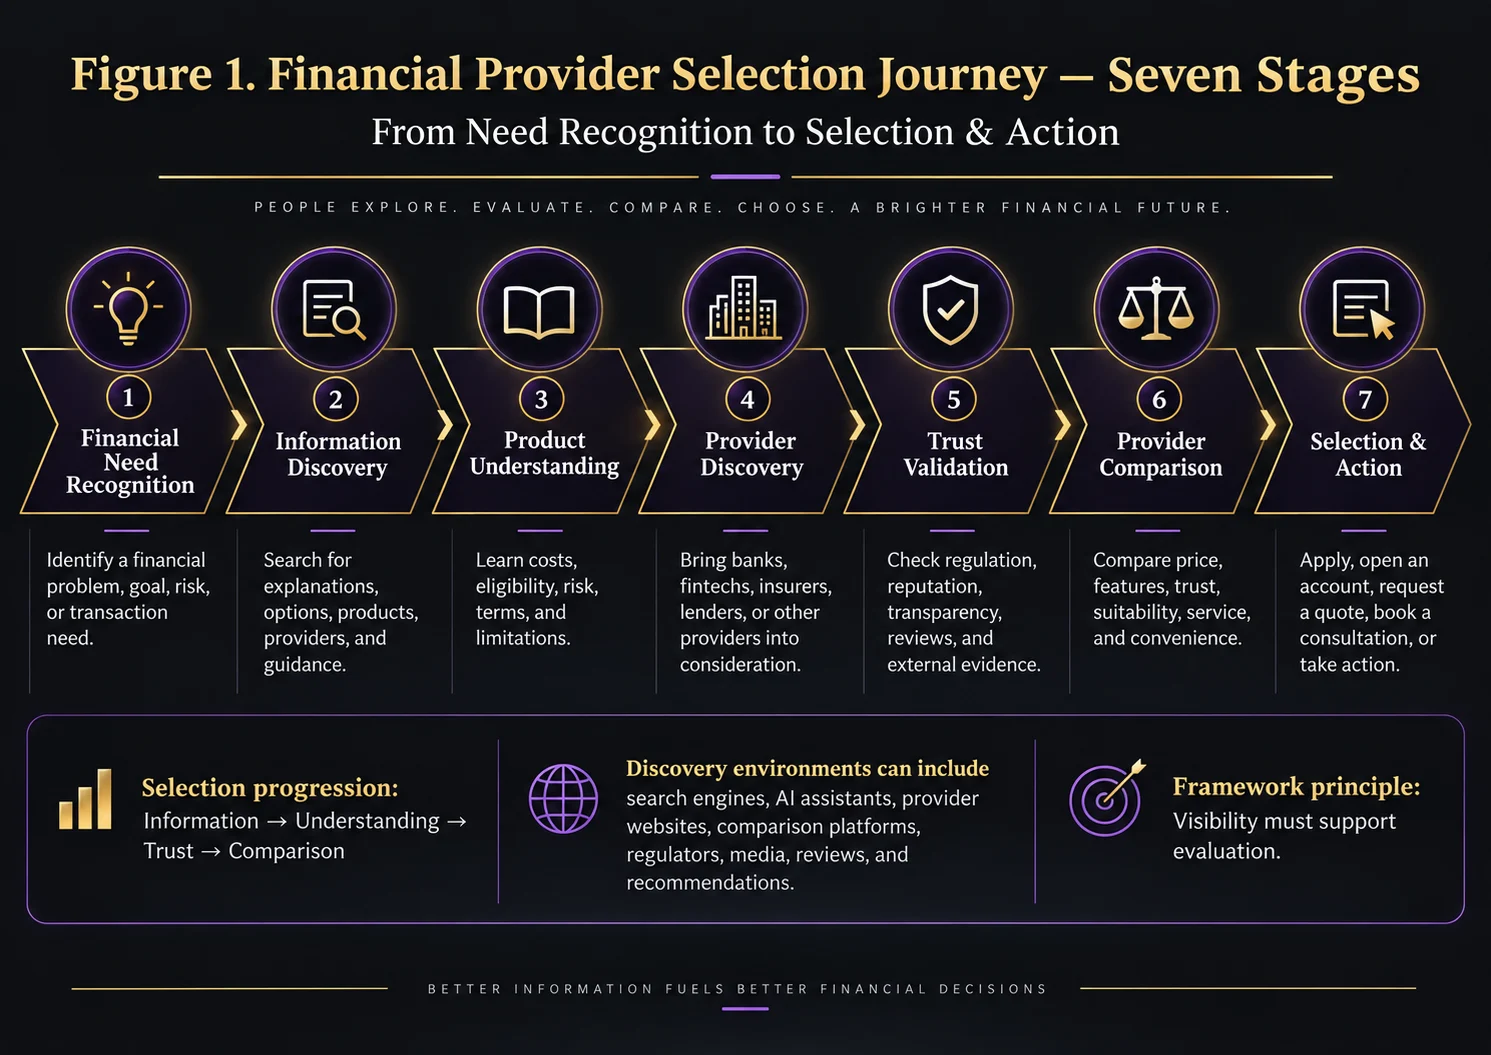
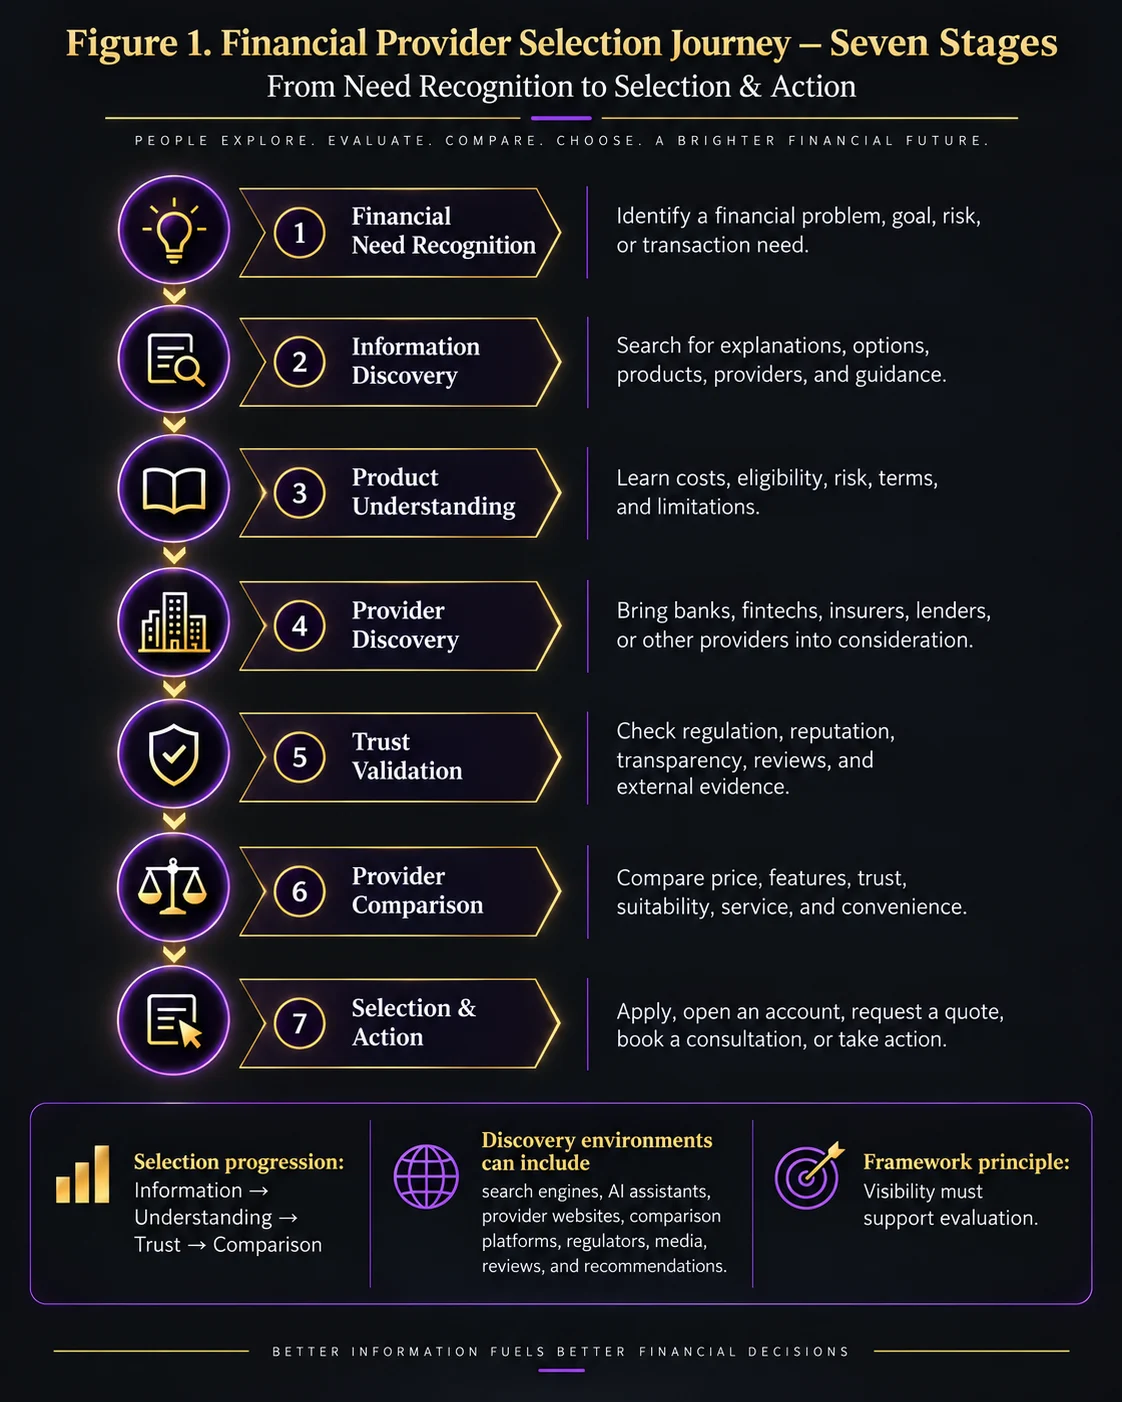
7. Seven Stages of Financial Provider Selection
- Financial Need Recognition
- Information Discovery
- Product Understanding
- Provider Discovery
- Trust Validation
- Provider Comparison
- Selection and Action
8. The Core Financial Selection Journey
The model can be represented as:
Need → Information → Understanding → Discovery → Trust → Comparison → Selection
9. Financial Provider Selection Is Rarely Linear
Users may move backwards and forwards between stages as new information changes their understanding or confidence.
10. A User May Return to Information Research
A prospective borrower may identify a lender and then return to information searches to understand:
- Interest rates
- Eligibility
- Early repayment
- Fees
- Risk
11. A User May Return to Trust Validation
After comparing products, the user may search independently for evidence about:
- Regulatory identity
- Reputation
- Reviews
- Complaints
- Financial strength
12. Financial Selection Is an Evidence-Accumulation Process
Confidence can increase as multiple forms of evidence reinforce the same understanding of the provider and product.
13. The Journey Can Be Consumer-Led
Consumer financial decisions may include:
- Bank accounts
- Mortgages
- Credit cards
- Insurance
- Savings
- Investment products
14. The Journey Can Be Business-Led
Business financial decisions may include:
- Commercial finance
- Merchant acquiring
- Business banking
- Cash-flow solutions
- Insurance
- Payment infrastructure
15. Financial Products Differ in Complexity
Selection behaviour will vary according to the financial significance, complexity and perceived risk of the decision.
16. Low-Complexity Financial Decisions
Some products can be evaluated relatively quickly where:
- Costs are transparent
- Eligibility is simple
- Risk is limited
- Switching is easy
17. High-Complexity Financial Decisions
Other products may require extensive research, comparison or professional advice.
18. Financial Stakes Affect Research Depth
A user may spend considerably more time evaluating a mortgage, investment provider or major business-finance arrangement than a low-value transactional product.
19. Regulation Affects Provider Evaluation
For regulated products or services, users may seek independent verification of the organisation or relevant financial entity before proceeding.
20. Trust Is Therefore Embedded Throughout the Journey
Trust is not limited to one final validation stage.
It influences how users interpret financial information from the beginning.
21. Search and AI Can Influence Multiple Stages
Search engines and AI assistants may participate in:
- Problem explanation
- Product education
- Provider discovery
- Comparison
- Trust validation
22. Comparison Platforms Also Influence Multiple Stages
Financial comparison services may simultaneously provide:
- Product education
- Provider discovery
- Price comparison
- Eligibility filtering
- Commercial referral
23. Provider Websites Remain Important
First-party information can provide authoritative detail about:
- Products
- Rates
- Fees
- Eligibility
- Applications
- Support
24. Provider Websites Are Not the Entire Decision Environment
Financial users frequently validate first-party claims through independent sources.
25. The Financial Discovery Environment Is Distributed
Potential environments include:
- Search engines
- AI assistants
- Provider websites
- Comparison platforms
- Regulatory sources
- Financial media
- Reviews
- Professional recommendations
26. Provider Identity Must Remain Understandable Across Environments
Users may encounter several descriptions of the same organisation during one decision journey.
27. Inconsistent Provider Identity Creates Friction
Conflicting information around names, products, regulation or pricing may increase uncertainty.
28. Product Consistency Also Matters
Material product information should remain sufficiently consistent across controlled and relevant external environments.
29. Product Information Can Change
Financial product authority requires attention to changing:
- Rates
- Fees
- Eligibility
- Promotions
- Terms
- Product availability
30. The Model Therefore Requires Freshness
Outdated financial information can damage user confidence even where the provider itself is legitimate and well established.
31. Stage One — Financial Need Recognition
The first stage begins when a consumer or organisation recognises a financial problem, requirement, risk or objective.
32. Need Recognition Can Be Explicit
A user may know exactly what is required.
Examples include:
- “I need a mortgage.”
- “I need business insurance.”
- “I need a merchant account.”
33. Need Recognition Can Be Ambiguous
Other users begin with uncertainty.
Examples may include:
- “How can I improve business cash flow?”
- “Where should I keep my savings?”
- “How can I reduce card processing costs?”
34. Ambiguous Needs Create Earlier Search Opportunity
Providers that explain the problem clearly may enter the user’s consideration before a product category has been selected.
35. Financial Needs Can Be Event-Driven
Financial searches may be triggered by events including:
- Buying a property
- Starting a business
- Hiring employees
- Retirement
- Travel
- Major purchases
36. Financial Needs Can Be Risk-Driven
Users may search because they want to reduce exposure to:
- Financial loss
- Fraud
- Debt
- Business interruption
- Investment risk
37. Financial Needs Can Be Cost-Driven
Users may begin searching because existing products appear expensive.
38. Financial Needs Can Be Service-Driven
Poor customer experience with an existing provider can trigger a new selection journey.
39. Financial Needs Can Be Technology-Driven
New payment methods, apps and financial technologies can create demand for provider comparison even where no immediate problem exists.
40. Need Recognition Creates Search Intent
The language used at this stage may be highly conversational and problem-led.
41. Early Financial Search Language
Users may search around:
- Problems
- Goals
- Costs
- Risks
- Eligibility
- Definitions
42. Search Intent May Not Match Product Terminology
Consumers may describe a need differently from the terminology used internally by financial providers.
43. Financial Content Should Bridge User Language and Product Language
A useful architecture connects:
User Need → Financial Concept → Product Category → Product → Provider
44. Early-Stage Content Should Reduce Confusion
The objective should be to help the user understand the nature of the financial decision rather than force immediate conversion.
45. Early-Stage Content Should Avoid False Certainty
Financial circumstances differ, and general information may not determine individual suitability.
46. Early-Stage Content Should Explain Important Variables
These may include:
- Eligibility
- Costs
- Risk
- Timescales
- Alternatives
47. Need Recognition Can Already Begin Provider Evaluation
Users may form early impressions of providers based on the clarity, usefulness and credibility of their information.
48. Stage One Search Objective
The strategic objective is to become discoverable where relevant financial needs begin to emerge.
49. Stage One User Objective
The user’s objective is to understand:
What problem do I have, and what type of financial solution might address it?
50. Stage One Provider Risk
Providers focused only on transactional product terms may enter the journey after other organisations have already shaped the user’s understanding.
51. Stage Two — Financial Information Discovery
Once a need has been recognised, the user begins gathering information about possible solutions.
52. Discovery May Begin with Search Engines
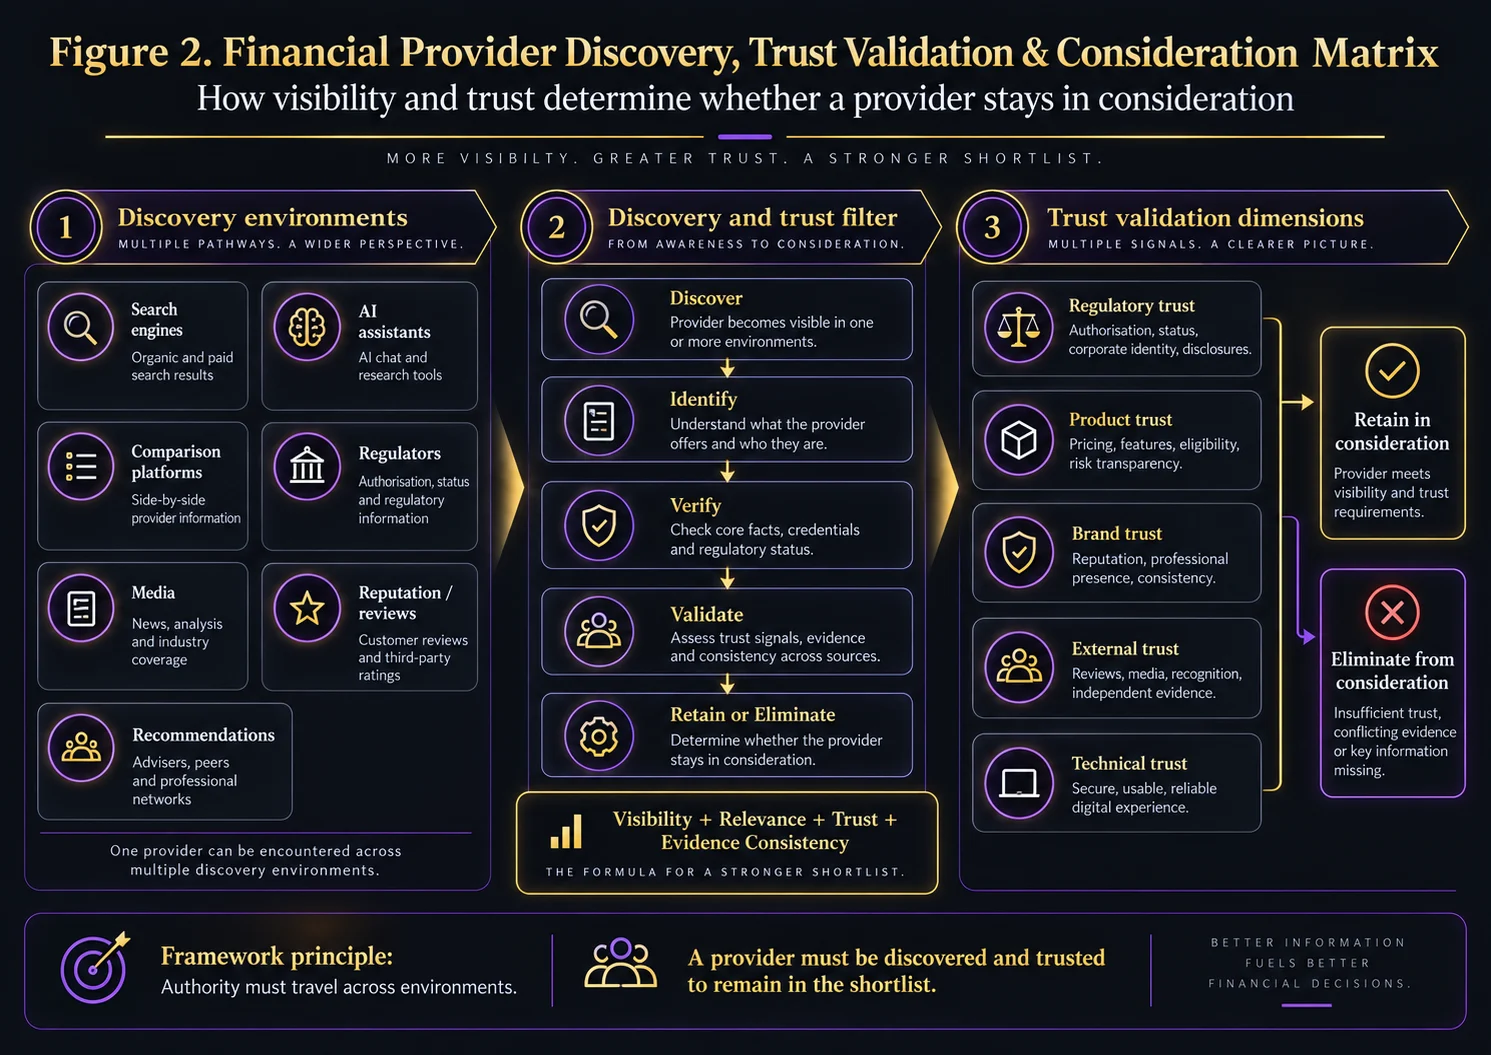
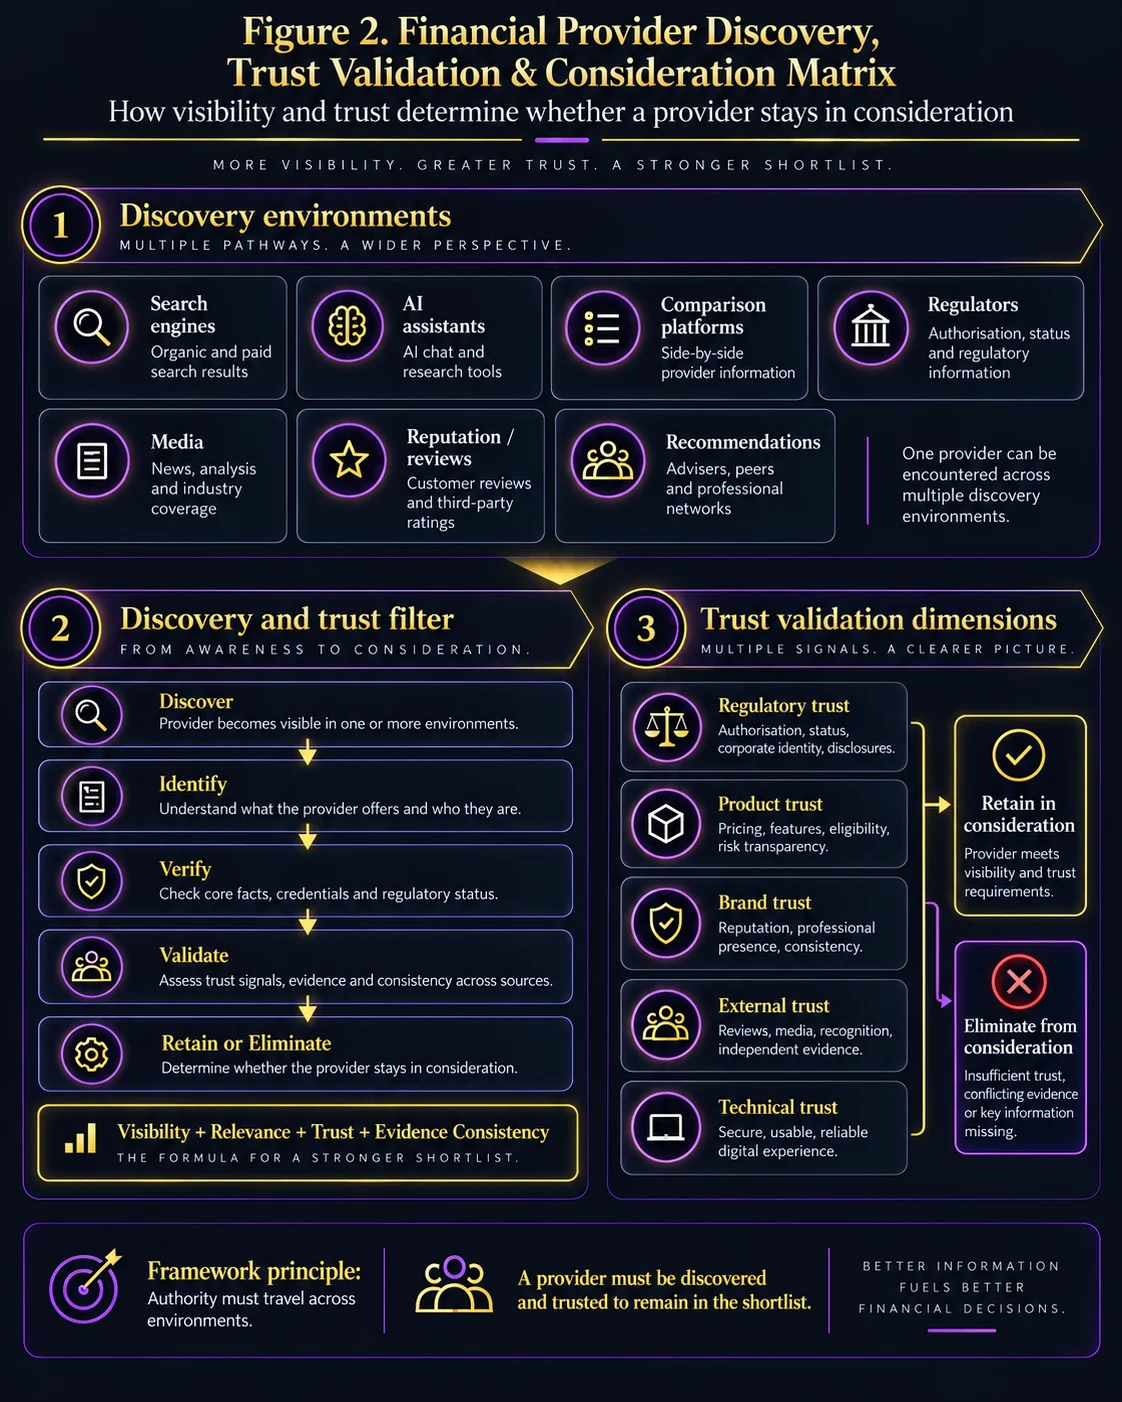
Traditional organic search can surface:
- Financial guides
- Provider pages
- Comparison platforms
- Regulatory sources
- Media
53. Discovery May Begin with AI Assistants
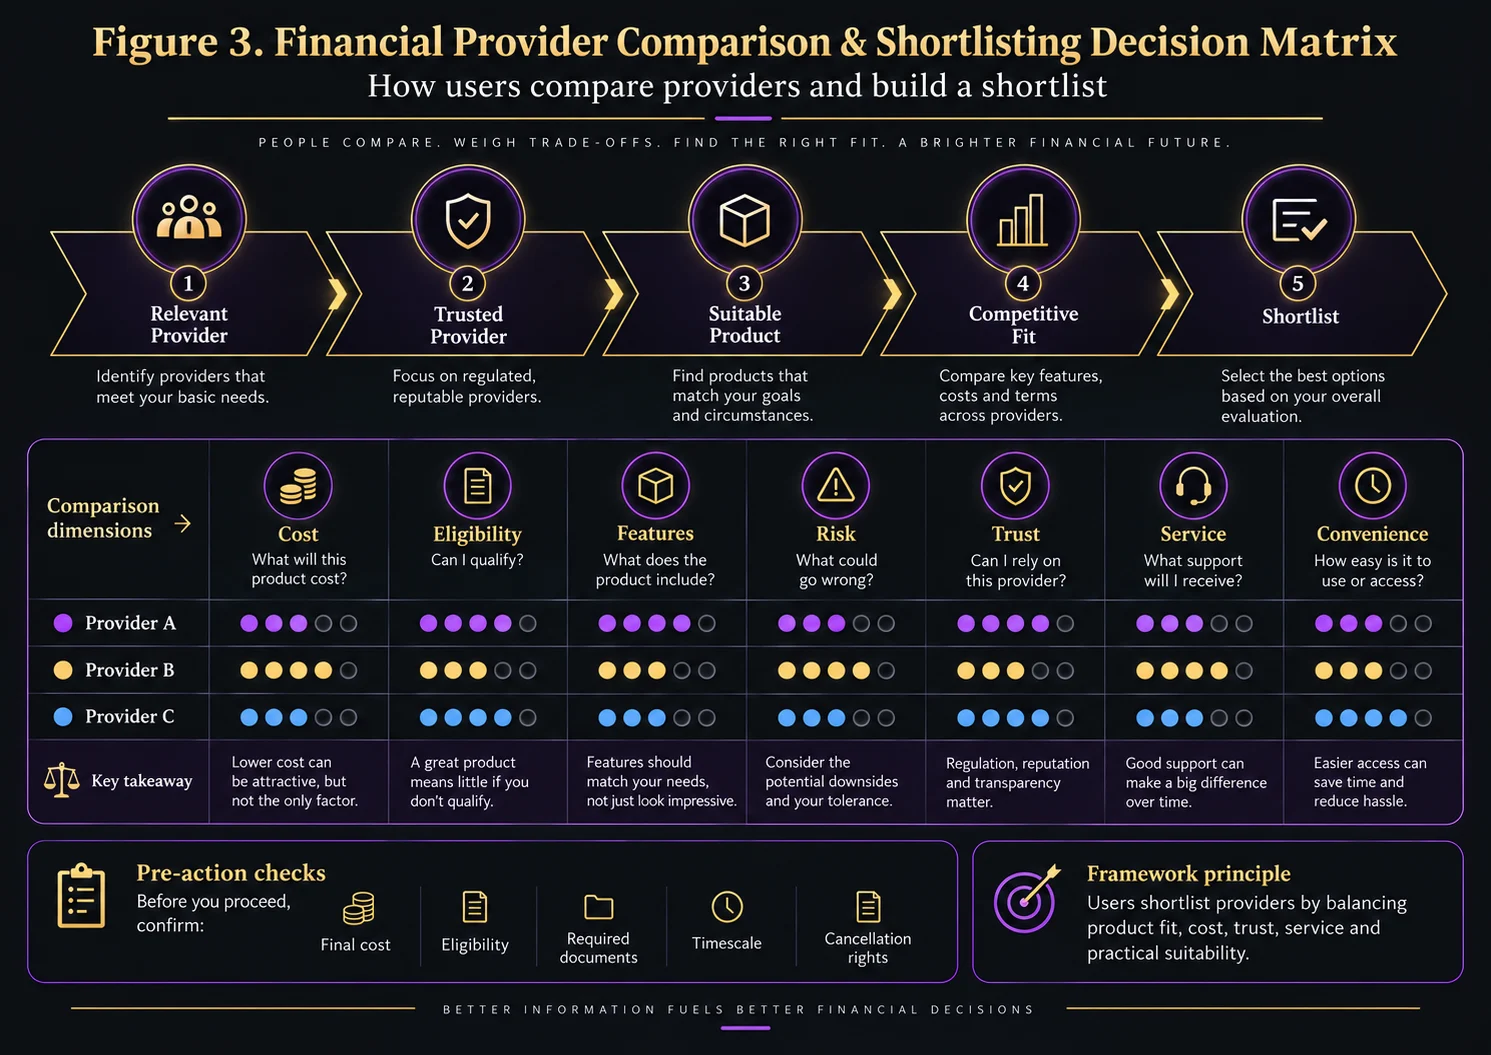
Users may ask conversational questions about:
- Products
- Providers
- Costs
- Risks
- Eligibility
54. AI Can Compress Early Research
An AI-generated response may summarise information that previously required multiple searches and website visits.
55. Compression Changes the Discovery Interface
A provider may influence the user’s understanding even when the user has not yet visited the provider’s website.
56. Discovery May Begin with Comparison Platforms
Users who already understand the product category may move directly into a comparison environment.
57. Discovery May Begin with Financial Media
Editorial articles and expert commentary may introduce:
- Products
- Providers
- Market trends
- Risks
- Consumer considerations
58. Discovery May Begin with Regulatory Sources
Higher-trust users may begin by verifying which organisations are appropriately recognised or authorised for the activity being considered.
59. Discovery May Begin with Recommendations
Users may receive provider suggestions from:
- Accountants
- Financial advisers
- Professional networks
- Friends
- Business contacts
60. Recommendation-Led Journeys Still Use Search
A referred user may subsequently search for:
- The provider
- The product
- Reviews
- Regulatory information
- Alternatives
61. Discovery Is Therefore Multi-Source
Financial decision-making increasingly depends on several evidence environments interacting with one another.
62. Discovery Sources Can Reinforce Each Other
Provider confidence can increase when search, regulatory, editorial and first-party information communicate a consistent identity.
63. Discovery Sources Can Also Conflict
Different sources may show:
- Different product terms
- Different names
- Outdated pricing
- Old branding
- Unclear regulatory relationships
64. Discovery Conflicts Increase Verification Work
Users may need additional searches before they feel confident enough to continue.
65. Financial Providers Should Map the Discovery Ecosystem
The organisation should identify where important financial information about the provider appears outside its own website.
66. First-Party Discovery Sources
These include:
- Corporate website
- Product pages
- Help centres
- Research
- Professional profiles
67. Regulatory Discovery Sources
Relevant official or regulatory sources may help users verify organisational identity and status.
68. Commercial Discovery Sources
Comparison and marketplace environments may influence which providers enter consideration.
69. Editorial Discovery Sources
Media and specialist publications may influence perceived expertise or credibility.
70. Reputation Discovery Sources
Reviews and customer commentary may shape expectations around service and experience.
71. AI-Mediated Discovery Sources
AI assistants may synthesise evidence drawn from several of these environments into one conversational response.
72. AI Discovery Creates a Source-Selection Layer
Providers may therefore need to understand not only whether they rank, but whether their information is sufficiently clear and corroborated to participate in machine-mediated discovery.
73. AI Source Visibility Is Not Complete Evidence of Causation
Where citations are visible, they can support source analysis, but they should not automatically be assumed to explain every part of a generated answer.
74. Discovery Strategy Should Prioritise Accuracy
Expanding visibility while material provider or product information remains inconsistent can increase confusion.
75. Discovery Strategy Should Prioritise Relevance
Visibility has limited value where the organisation is surfaced for financial needs it cannot appropriately serve.
76. Discovery Strategy Should Prioritise Trust
The environments through which providers are discovered can influence the confidence attached to them.
77. Stage Two User Objective
The user is trying to answer:
What types of solutions, products and providers might be relevant to my financial need?
78. Stage Two Provider Objective
The provider’s objective is to participate accurately across the discovery environments influencing the decision.
79. Stage Two Provider Risk
A provider may remain invisible even with a strong website if it is poorly represented across important external discovery environments.
80. Stage Three — Product Understanding
Once a possible solution has been identified, the user needs to understand how the relevant financial product actually works.
81. Product Understanding Is a Critical Decision Layer
A user cannot compare providers effectively without understanding the underlying product.
82. Financial Product Complexity Creates Information Demand
Users may need explanations of:
- Eligibility
- Pricing
- Interest
- Fees
- Terms
- Risk
- Restrictions
83. Product Understanding Can Reduce Perceived Uncertainty
Clear explanations can help users determine whether a product is worth evaluating further.
84. Product Understanding Can Also Eliminate a Provider
Transparent information may reveal that a product is not suitable for a particular user.
85. Appropriate Elimination Is Not Failure
Filtering unsuitable users before application can improve the quality of later-stage demand.
86. Explain Product Purpose
Users should understand what the product is designed to do.
87. Explain Eligibility
Where appropriate, product information should explain who may qualify.
88. Explain Costs
Potential costs may include:
- Interest
- Fees
- Premiums
- Transaction charges
- Management charges
89. Explain Product Features
Features should be represented clearly enough for meaningful comparison.
90. Explain Restrictions
Users may need to understand:
- Limits
- Exclusions
- Lock-in periods
- Usage requirements
- Withdrawal conditions
91. Explain Risk
Financial information should not obscure material risks associated with a product or decision.
92. Explain Relevant Protections
Where applicable, users may need information about relevant consumer or customer protections.
93. Explain the Application Process
Users should understand important steps required to progress.
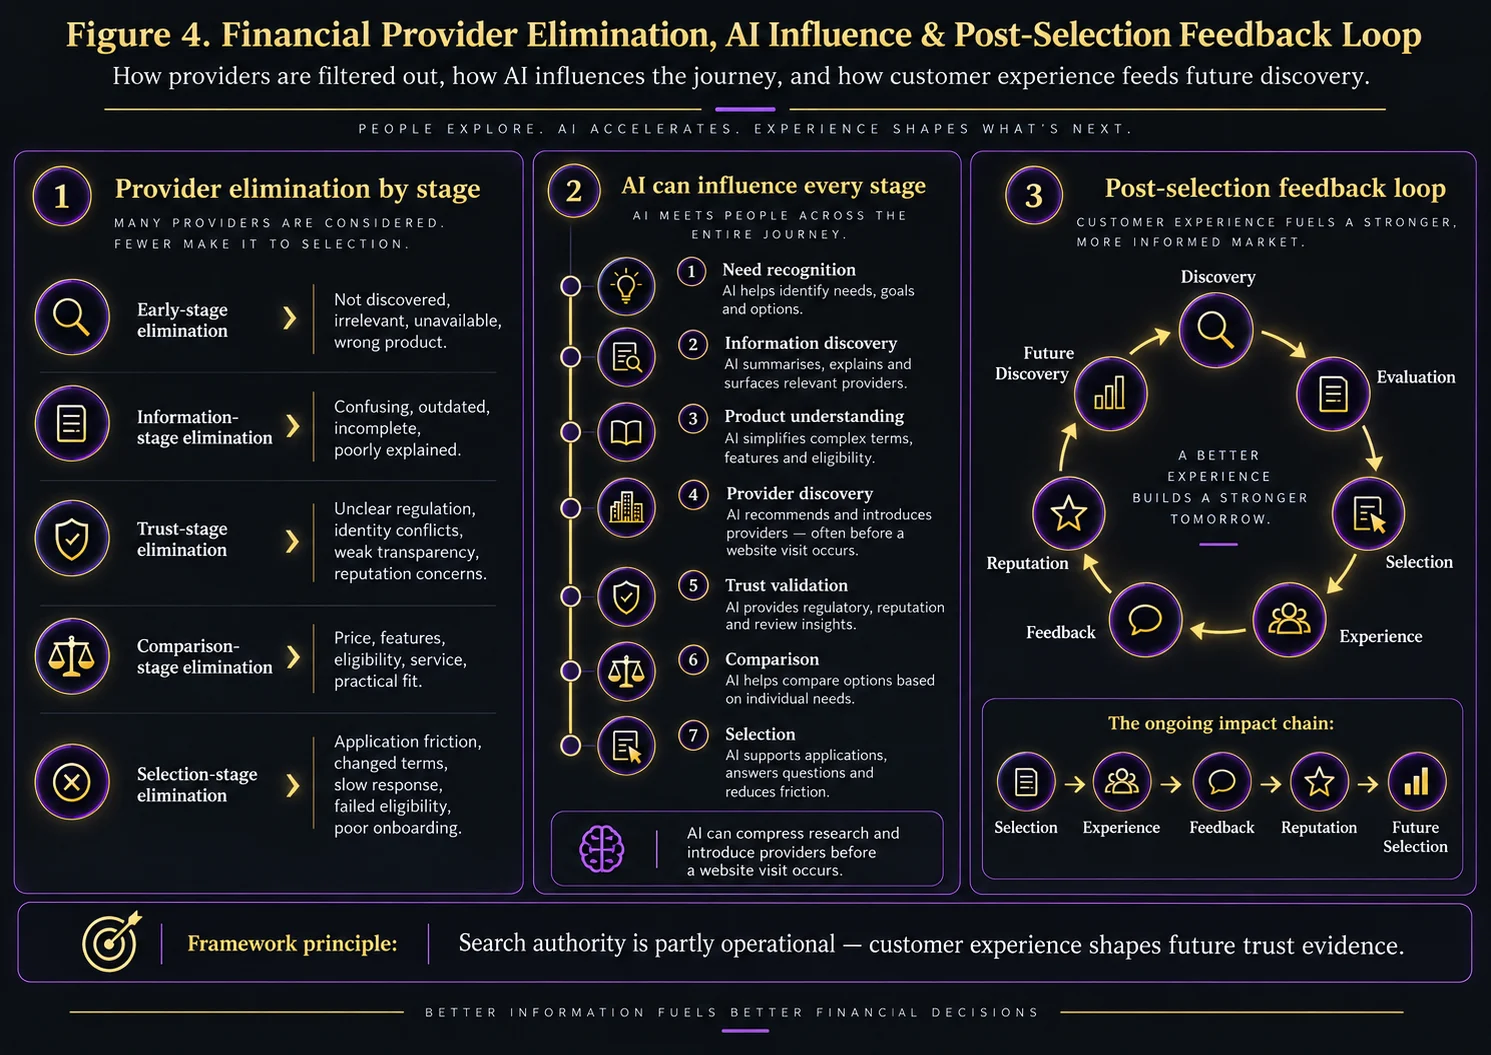
94. Explain Required Documentation
Where relevant, this may include:
- Identity evidence
- Income evidence
- Business records
- Financial information
- Property information
95. Explain Timeframes Carefully
Where timing depends on verification or individual circumstances, providers should avoid creating false certainty.
96. Product Information Should Be Comparable
Clear product structure can reduce the effort required to compare alternatives.
97. Product Information Architecture
A useful path is:
Need → Product Category → Product Type → Eligibility → Costs → Features → Risk → Provider
98. Mortgage Example
A mortgage journey might develop through:
Home Purchase → Mortgage Research → Mortgage Type → Eligibility → Rates & Fees → Lender Evaluation
99. Insurance Example
An insurance journey might develop through:
Protection Need → Insurance Type → Cover → Exclusions → Premium → Insurer Evaluation
100. Business Finance Example
A business-finance journey might develop through:
Funding Need → Finance Options → Eligibility → Cost → Repayment Structure → Provider Evaluation
101. Payments Example
A payments journey might develop through:
Payment Need → Acceptance Method → Transaction Costs → Hardware or Software → Settlement → Provider Evaluation
102. Investment Example
An investment journey might develop through:
Investment Goal → Risk Understanding → Product Type → Costs → Access → Provider Evaluation
103. Product Content Should Support Different Knowledge Levels
Some users require introductory explanations, while others need detailed product specifications.
104. Layered Financial Information Can Support Both
A useful product environment may combine:
- Plain-language summary
- Detailed features
- Eligibility
- Pricing
- Risk information
- Supporting documentation
105. Calculators Can Support Product Understanding
Where appropriate, tools may help users estimate:
- Repayments
- Savings
- Costs
- Potential fees
- Affordability
106. Calculators Should Explain Assumptions
An estimate should not be presented as a guaranteed outcome where actual costs depend on individual circumstances.
107. Comparison Tables Can Support Understanding
Structured tables can help users distinguish between:
- Product types
- Features
- Costs
- Eligibility
- Restrictions
108. Comparison Tables Should Remain Current
Outdated rates, fees or product availability can undermine otherwise strong financial information.
109. Product Understanding Affects Trust
Clarity around costs, limitations and risk can influence how transparent the provider appears.
110. Product Understanding Affects Comparison
Users who understand the product are better positioned to compare providers on meaningful criteria.
111. Product Understanding Affects Conversion Quality
Well-informed users may enter the application or enquiry stage with clearer expectations.
112. Product Understanding Can Reduce Unsuitable Applications
Clear eligibility and suitability information can prevent some users from progressing toward products that are not relevant to them.
113. Product Content Should Avoid Promotional Distortion
Benefits should not be presented without sufficient explanation of relevant costs, conditions or limitations.
114. Product Content Should Be Governed
Financial product information may require review when:
- Rates change
- Fees change
- Eligibility changes
- Terms change
- Products are withdrawn
115. Product Governance Supports Search Accuracy
Clear update processes can reduce the persistence of outdated financial information across search and AI discovery environments.
116. Stage Three User Objective
The user’s question becomes:
How does this financial product work, what will it cost, what are the risks, and might it be suitable for my needs?
117. Stage Three Provider Objective
The provider’s objective is to make material product information sufficiently understandable for informed evaluation.
118. Stage Three Provider Risk
Complex, incomplete or outdated information can push users toward comparison sites, competitors or other sources before the provider has established sufficient confidence.
119. The First Three Stages Build Financial Decision Context
The journey to this point can be represented as:
Need Recognition → Information Discovery → Product Understanding
120. Provider Selection Begins Before Provider Comparison
By the time a user starts naming and comparing providers, earlier information sources may already have shaped which organisations appear credible or relevant.
121. The Next Stage Is Provider Discovery
The next stage examines how banks, fintechs, insurers, lenders, investment organisations and other financial providers enter the user’s active consideration set across search, AI, comparison, regulatory, media and recommendation environments.
Figure 1 : Financial Provider Selection Journey — Seven Stages from Need Recognition to Selection & Action.
122. Stage Four — Financial Provider Discovery
Once users understand the type of product or solution they may need, they begin identifying which financial organisations should enter active consideration.
123. Provider Discovery Is a Competitive Filtering Stage
The user moves from understanding the category to asking:
Which providers are relevant to my financial need?
124. Discovery Can Be Branded
Some users already know one or more providers and begin by searching for:
- Brand names
- Specific products
- Current rates
- Reviews
125. Discovery Can Be Non-Branded
Other users search more broadly for:
- Best providers
- Product recommendations
- Local providers
- Sector-specific providers
- Alternatives
126. Discovery Can Be Comparison-Led
Users may move directly into environments designed to compare:
- Prices
- Rates
- Features
- Eligibility
- Benefits
127. Discovery Can Be AI-Led
Users may ask conversational questions such as:
- Which providers are suitable for this need?
- What are the main options?
- Which providers should I compare?
128. AI Can Create an Initial Provider Set
A generated response may expose users to providers they had not previously considered.
129. Provider Discovery Can Be Media-Led
Financial media, specialist publications and review platforms can influence which organisations enter the user’s consideration set.
130. Provider Discovery Can Be Recommendation-Led
Recommendations from advisers, accountants, brokers, peers or professional networks can strongly shape initial provider consideration.
131. Discovery Is Therefore Distributed
Potential provider-discovery environments include:
- Organic search
- Paid search
- Local search
- AI assistants
- Comparison platforms
- Financial media
- Professional referrals
- Review platforms
132. Provider Discovery Depends on Relevance
Visibility is only useful where the provider genuinely fits the user’s:
- Product need
- Eligibility
- Location
- Business type
- Risk profile
133. Provider Discovery Depends on Category Clarity
Search and AI systems need sufficiently clear evidence of what the provider actually offers.
134. Provider Discovery Depends on Entity Clarity
The organisation should be identifiable across relevant:
- Brand
- Legal entity
- Product entities
- Locations
- Professional relationships
135. Provider Discovery Depends on Product Mapping
The relationship between provider and product should be explicit.
136. Product-to-Provider Relationship
A useful model is:
Provider → Product Category → Product → Eligibility → Market
137. Business Financial Providers May Need Sector Mapping
Some business finance providers may also benefit from clear relationships with:
- Industry sectors
- Business sizes
- Transaction volumes
- Commercial use cases
138. Local Provider Discovery Can Matter
Location may influence selection where:
- Branches matter
- Face-to-face advice is required
- Local professional relationships matter
- Geographic product availability differs
139. Digital-Only Providers Change Local Discovery
Some financial services may be delivered nationally or internationally without physical branch dependence.
140. Geographic Availability Still Requires Clarity
Digital delivery does not remove the need to explain where products or services are available.
141. Discovery Pages Should Match User Intent
A user searching for a provider category should not be forced immediately into a product page that assumes substantial prior knowledge.
142. Provider Category Content
Useful category-level information may explain:
- Who the provider serves
- What products are offered
- Geographic availability
- Key differentiators
143. Search Visibility Should Be Segmented by Product
Whole-domain visibility can conceal weaknesses in strategically important product categories.
144. Search Visibility Should Be Segmented by Market
Financial providers operating across regions should understand where visibility differs by geography.
145. Search Visibility Should Be Segmented by Audience
Consumer, SME and enterprise financial searches may require different provider evidence.
146. AI Provider Discovery Should Be Segmented
Monitoring may distinguish between:
- Brand prompts
- Product prompts
- Audience prompts
- Local prompts
- Comparison prompts
147. Relevant Provider Presence Matters More Than Raw Frequency
Appearing repeatedly for unsuitable financial needs should not be treated as stronger discovery performance.
148. Provider Discovery Can Be Influenced by External Sources
AI and search systems may rely on information from:
- Comparison sites
- Regulatory sources
- Media
- Reviews
- Directories
149. External Source Consistency Matters
Material facts should not conflict unnecessarily across major evidence environments.
150. Discovery Accuracy Should Be Monitored
Financial organisations should track whether they are associated with:
- Correct products
- Correct markets
- Correct pricing context
- Correct provider type
151. Discovery Errors Can Be Material
Examples include:
- Wrong product availability
- Incorrect market coverage
- Outdated branding
- Wrong regulatory identity
152. Provider Discovery Should Not Depend on One Channel
A resilient discovery strategy reduces dependence on any single:
- Search engine
- Comparison site
- AI system
- Referral source
153. Discovery Resilience Comes from Evidence Diversity
Strong providers may be represented consistently across:
- First-party content
- Regulatory sources
- Comparison environments
- Editorial sources
- Reputation sources
154. Discovery Resilience Does Not Mean Maximum Presence Everywhere
The objective is relevant and credible presence rather than indiscriminate distribution.
155. Stage Four User Objective
The user’s question becomes:
Which financial providers appear relevant enough to investigate further?
156. Stage Four Provider Objective
The provider’s objective is to enter the appropriate consideration set accurately and credibly.
157. Stage Four Provider Risk
A provider may lose consideration before any direct website visit if it is absent, inaccurately represented or weakly corroborated across influential discovery environments.
158. Stage Five — Financial Trust Validation
Once one or more providers enter active consideration, users begin testing whether those organisations are sufficiently credible to continue evaluating.
159. Trust Validation Is Especially Important in Financial Services
Financial decisions may involve:
- Money
- Personal data
- Long-term commitments
- Investment risk
- Credit exposure
160. Trust Is Multi-Layered
Users may evaluate:
- Regulatory trust
- Brand trust
- Product trust
- Reputation trust
- Operational trust
161. Regulatory Trust
Where applicable, users may want to verify whether a provider or relevant entity is appropriately recognised, registered or authorised.
162. Regulatory Identity Should Be Clear
The relationship between:
- Brand
- Legal entity
- Regulated entity
should be sufficiently understandable.
163. Brand and Legal Entity Are Not Always the Same
Financial groups may operate several brands, subsidiaries or regulated entities.
164. Trust Architecture Should Explain These Relationships
Ambiguity around who actually provides a financial product can increase user uncertainty.
165. Regulatory References Should Be Current
Outdated regulatory wording can materially weaken trust.
166. Trust Validation May Include Official Sources
Users may check independent regulatory or official registers where appropriate.
167. Provider Websites Should Support Verification
Relevant identity information should be accessible rather than hidden unnecessarily.
168. Product Trust Is Distinct from Provider Trust
A user may trust the organisation but still question whether a specific product is appropriate.
169. Product Trust Can Depend on Transparency
Users may assess whether the provider explains:
- Costs
- Eligibility
- Risks
- Restrictions
- Terms
170. Brand Trust Can Depend on Familiarity
Well-known organisations may benefit from existing awareness, but familiarity should not replace clear product evidence.
171. Newer Financial Brands Face a Different Trust Challenge
Fintechs and newer providers may require stronger external corroboration because users have less pre-existing familiarity.
172. Reputation Trust
Users may review:
- Customer feedback
- Complaints
- Editorial coverage
- Independent reviews
173. Reviews Can Influence Financial Provider Selection
Reviews may shape expectations about:
- Customer service
- App usability
- Claims handling
- Support
- Problem resolution
174. Reviews Should Not Be Treated as Regulatory Evidence
A high review rating does not replace formal provider verification.
175. Reviews Should Not Be Treated as Product Suitability Evidence
Positive experiences from other users do not establish whether a product is suitable for a particular person or business.
176. Review Recency Matters
Customer experience can change as products, systems and support operations evolve.
177. Review Volume Matters Contextually
A large review volume may provide broader experience evidence, but quantity alone should not determine trust.
178. Review Themes Can Be More Useful Than Averages
Recurring themes may reveal:
- Service strengths
- Operational weaknesses
- Support problems
- Onboarding friction
179. Complaints Can Influence Trust
Users may search for complaints or negative experiences before committing.
180. Complaint Presence Is Not Automatically Disqualifying
The context, pattern, recency and response may matter more than the mere existence of complaints.
181. Financial Media Can Influence Trust
Independent coverage may reinforce or weaken provider confidence depending on the context.
182. Editorial Trust Should Be Interpreted Carefully
Media coverage can provide external context but should not be treated automatically as proof of product suitability.
183. Awards Can Influence Trust
Relevant awards may strengthen credibility where they are:
- Current
- Specific
- Properly attributed
- Relevant to the product or provider
184. Awards Should Not Become Universal Claims
Recognition in one category should not be presented as proof of superiority across all financial services.
185. Financial Strength May Matter
Depending on the product, users may consider evidence relating to organisational scale, stability or financial resilience.
186. Financial Strength Signals Require Context
The relevance of such evidence varies substantially between product categories.
187. Security and Data Protection Can Influence Trust
Users may want to understand how the provider manages:
- Personal information
- Authentication
- Fraud prevention
- Account security
188. Operational Trust
Users may judge trust based on practical indicators such as:
- Website quality
- Application clarity
- Support accessibility
- Contact information
189. Poor Digital Experience Can Damage Trust
Broken forms, inconsistent pricing or inaccessible support may undermine confidence even when regulatory evidence is strong.
190. Trust Validation Can Be Branded Search
Users may search directly for:
- Provider reviews
- Provider complaints
- Provider regulation
- Provider safety
191. Trust Validation Can Be AI-Assisted
Users may ask AI systems whether a provider appears legitimate, regulated or reputable.
192. AI Trust Summaries Require Caution
Generated responses can simplify complex regulatory or reputational evidence.
193. AI Trust Errors Can Be Material
Inaccurate claims about regulation, ownership or provider status can substantially affect user confidence.
194. Providers Should Monitor Material AI Trust Errors
Persistent inaccuracies should trigger source investigation.
195. Trust Source Mapping
Financial organisations should identify which sources users and search systems may use for trust validation.
196. First-Party Trust Sources
These may include:
- About pages
- Legal information
- Product disclosures
- Security information
- Customer-support information
197. Regulatory Trust Sources
Official sources may provide independent verification of relevant organisational or professional status.
198. Reputation Trust Sources
These may include:
- Reviews
- Complaints
- Editorial coverage
- Independent assessments
199. Trust Evidence Should Be Consistent
Material facts should align across high-value evidence environments.
200. Trust Evidence Should Be Current
Old regulatory, pricing or product information can create unnecessary uncertainty.
201. Trust Evidence Should Be Specific
Broad statements such as “trusted provider” have limited value without supporting evidence.
202. Trust Evidence Should Be Verifiable
Important claims should be capable of independent checking where appropriate.
203. Trust Validation Can Eliminate Providers
Users may remove an organisation from consideration if they encounter:
- Unclear regulation
- Conflicting identity
- Poor transparency
- Persistent reputation concerns
204. Trust Validation Can Strengthen Shortlisting
Consistent evidence across several sources may move a provider from awareness to active consideration.
205. Trust Thresholds Differ by Product
Users may demand greater verification for:
- Investments
- Long-term borrowing
- Insurance
- Business finance
206. Trust Thresholds Differ by User
Some users rely heavily on established brands, while others prioritise pricing, digital experience or specialist capability.
207. Consumer Trust Thresholds
Consumers may emphasise:
- Safety
- Cost
- Ease of use
- Customer service
208. Business Trust Thresholds
Business users may additionally evaluate:
- Reliability
- Scalability
- Integration
- Support
- Commercial fit
209. Enterprise Trust Thresholds
Larger organisations may require deeper assessment of:
- Security
- Governance
- Contract terms
- Operational resilience
- Procurement requirements
210. Trust Validation Should Support Informed Comparison
The purpose is not simply to prove that a provider exists.
It is to establish whether the provider appears credible enough to remain in the comparison set.
211. Stage Five User Objective
The user’s question becomes:
Can I trust this provider enough to compare it seriously with the alternatives?
212. Stage Five Provider Objective
The provider’s objective is to make trust evidence clear, current and independently verifiable where appropriate.
213. Stage Five Provider Risk
Weak or inconsistent trust evidence may eliminate the provider before price or product features are compared fully.
214. Discovery and Trust Form One Combined Filter
A financial provider must first enter the consideration set and then survive trust validation.
215. The Combined Provider Filter
The process can be represented as:
Discover → Identify → Verify → Validate → Retain or Eliminate
216. Strong Discovery Without Trust Is Fragile
High visibility may generate awareness without sustained consideration.
217. Strong Trust Without Discovery Is Also Limited
A credible provider cannot enter the user’s shortlist if it is rarely discovered.
218. Provider Selection Therefore Requires Both
A resilient financial discovery strategy combines:
Visibility + Relevance + Trust + Evidence Consistency
219. The Next Stage Is Provider Comparison
Once a financial organisation survives discovery and trust validation, users begin comparing remaining providers across product suitability, price, service, practical fit and overall value.
Figure 2 : Financial Provider Discovery, Trust Validation & Consideration Matrix.
220. Stage Six — Financial Provider Comparison
Once a provider has survived discovery and trust validation, the user begins comparing it directly with competing organisations, products or alternatives.
221. Comparison Converts Consideration into a Shortlist
At this stage, users are no longer asking only whether a provider appears credible.
They are asking whether it is the best fit for their specific financial need.
222. Financial Comparison Is Multi-Criteria
Users may evaluate:
- Price
- Rates
- Fees
- Features
- Eligibility
- Service
- Risk
- Convenience
223. The Importance of Each Criterion Varies
The weighting assigned to each factor depends on the product, user and decision context.
224. Price Is Important but Rarely the Only Factor
The lowest apparent cost may not provide the strongest overall value where:
- Features differ
- Eligibility differs
- Service differs
- Risk differs
- Support differs
225. Compare Total Cost Rather Than Headline Price Alone
Users may need to consider:
- Upfront charges
- Ongoing fees
- Interest
- Penalties
- Transaction charges
- Exit costs
226. Financial Products Can Use Different Pricing Structures
Direct comparison becomes more difficult when providers present costs using different models.
227. Transparent Pricing Supports Comparison
Clear disclosure can reduce the effort required to determine the real financial difference between providers.
228. Compare Product Features
Users may compare:
- Limits
- Access
- Flexibility
- Benefits
- Protection
- Functionality
229. Compare Eligibility
A provider may be attractive in theory but irrelevant if the user does not meet eligibility criteria.
230. Eligibility Can Be a Primary Filter
Users may eliminate providers before deeper comparison if eligibility is clearly incompatible.
231. Compare Product Availability
Availability may vary according to:
- Location
- Residency
- Business type
- Turnover
- Credit profile
232. Compare Risk
For some products, users may compare:
- Investment risk
- Borrowing exposure
- Insurance exclusions
- Operational dependency
- Financial commitment
233. Compare Flexibility
Users may value:
- Early repayment
- Withdrawal access
- Product switching
- Contract flexibility
- Scalability
234. Compare Customer Service
Service expectations may influence provider selection even when core product terms are similar.
235. Service Comparison May Include
- Telephone support
- Digital support
- Branch access
- Account management
- Response times
236. Compare Digital Experience
For digital financial products, users may evaluate:
- App quality
- Portal usability
- Onboarding
- Account management
- Self-service functionality
237. Compare Human Support
Complex financial decisions may increase the value of access to experienced staff or advisers.
238. Compare Provider Scale
Some users may prefer established scale, while others may value the specialist focus or agility of a smaller provider.
239. Compare Specialist Relevance
A specialist provider may be more attractive where the financial requirement is unusual or sector-specific.
240. Compare Business-Fit Evidence
Business customers may assess whether the provider understands:
- Their industry
- Their size
- Their transaction profile
- Their operational requirements
241. Compare Integration Capability
Technology-dependent financial services may need to integrate with:
- Accounting software
- Ecommerce platforms
- Point-of-sale systems
- Enterprise software
- Existing banking systems
242. Compare Implementation Complexity
Business users may consider how difficult it will be to:
- Switch
- Migrate
- Integrate
- Train staff
- Change internal processes
243. Compare Switching Costs
A user may remain with an existing provider if the financial or operational cost of switching outweighs the potential benefit.
244. Switching Costs Can Be Financial
These may include:
- Exit fees
- Termination charges
- New setup costs
- Equipment costs
245. Switching Costs Can Be Operational
These may include:
- Migration effort
- Staff training
- System disruption
- Customer communication
246. Switching Friction Can Reduce Provider Conversion
Even a stronger product may lose if switching appears too difficult.
247. Providers Can Reduce Switching Friction
Useful information may explain:
- Migration process
- Implementation support
- Timescales
- Data transfer
- Account setup
248. Compare Contract Terms
Users may evaluate:
- Minimum terms
- Renewal conditions
- Cancellation rights
- Exit clauses
- Notice periods
249. Contract Complexity Can Affect Selection
Opaque or difficult-to-interpret commercial terms may reduce confidence.
250. Compare Promotional Offers Carefully
Introductory rates, cashback or temporary discounts should be assessed against the longer-term product economics.
251. Headline Promotions Can Distort Comparison
A strong initial offer may be less attractive once:
- Promotional periods end
- Ongoing fees apply
- Eligibility restrictions are considered
252. Compare Long-Term Value
Users may need to assess the expected value of the relationship beyond the first transaction.
253. Long-Term Value Is Product-Specific
For some products, long-term value may depend on:
- Interest
- Charges
- Support
- Switching flexibility
- Product evolution
254. Comparison Can Be Consumer-Led
Consumers may place greater weight on:
- Price
- Convenience
- Ease of use
- Customer service
- Brand confidence
255. Comparison Can Be SME-Led
Small and medium-sized businesses may place greater weight on:
- Cost
- Cash flow
- Support
- Integration
- Operational fit
256. Comparison Can Be Enterprise-Led
Larger organisations may place greater weight on:
- Security
- Governance
- Integration
- Scalability
- Contract structure
- Operational resilience
257. Comparison Can Be High-Stakes
Mortgages, investments and long-term financial commitments may require more extensive evaluation than lower-value transactional products.
258. High-Stakes Comparison Often Includes More Independent Verification
Users may spend more time reviewing:
- Regulatory evidence
- Independent reviews
- Product documentation
- Professional advice
259. Comparison Can Be Urgent
In some situations, speed may become a dominant criterion.
260. Urgency Changes Weighting
A business facing an immediate funding or payments problem may place more weight on:
- Availability
- Approval speed
- Implementation time
- Support
261. Provider Comparison Creates a Decision Matrix
Users effectively assign different weights to competing selection criteria.
262. Example Consumer Comparison Matrix
A consumer may implicitly compare:
Cost + Product Fit + Trust + Convenience + Service
263. Example Business Comparison Matrix
A business may implicitly compare:
Commercial Fit + Cost + Integration + Reliability + Support + Scalability
264. Example Investment Comparison Matrix
An investor may compare:
Risk + Cost + Product Range + Access + Trust + Service
265. Example Insurance Comparison Matrix
An insurance customer may compare:
Cover + Exclusions + Premium + Claims Experience + Trust
266. Example Mortgage Comparison Matrix
A mortgage customer may compare:
Rate + Fees + Eligibility + Flexibility + Service + Trust
267. Comparison Platforms Formalise the Matrix
Comparison sites may turn these criteria into filters and ranked lists.
268. Comparison Rankings Are Usually Method-Specific
A provider’s position can depend on:
- User inputs
- Sorting method
- Eligibility
- Commercial relationships
- Product availability
269. Users Should Understand Comparison Context
A comparison platform’s default ordering should not automatically be treated as a universal measure of provider quality.
270. Provider Websites Can Also Support Comparison
Providers may explain how their products differ from:
- Alternative product types
- Traditional approaches
- Other options within their own range
271. Comparative Content Should Be Accurate
Providers should avoid misleading or unsupported competitor claims.
272. Comparison Content Should Focus on User Fit
A useful comparison explains which option may be appropriate under different circumstances.
273. AI Can Become a Comparison Interface
Users may ask AI assistants to compare:
- Providers
- Products
- Rates
- Features
- Pros and cons
274. AI Can Compress Provider Comparison
A generated answer may summarise several providers before the user visits any of their websites.
275. AI Comparison Can Change the Shortlist
Providers may be introduced or eliminated through generated recommendations.
276. AI Comparison Accuracy Is Therefore Important
Financial organisations should monitor whether generated comparisons accurately reflect:
- Current products
- Current features
- Availability
- Provider identity
- Relevant limitations
277. AI Comparisons May Become Outdated
Product terms can change faster than generated systems or underlying external sources update.
278. Product Freshness Is a Major Comparison Requirement
Rates, fees and product availability should be governed actively.
279. Persistent AI Comparison Errors Should Be Investigated
The provider should examine whether inaccurate information appears across:
- First-party pages
- Comparison sites
- Editorial sources
- Archived product information
280. Comparison Evidence Should Be Multi-Source
A user may compare one provider using:
- Provider website
- Comparison site
- AI assistant
- Reviews
- Regulatory information
281. Cross-Source Consistency Reduces Friction
Users can compare more confidently where material facts align across major environments.
282. Comparison Can Reveal Inconsistency
Different rates, features or availability information may cause the user to pause or abandon the provider.
283. Comparison Should Support Shortlisting
The objective of this stage is to reduce the provider set to a smaller number of credible alternatives.
284. Shortlisting Is an Elimination Process
Providers may be removed because of:
- Poor fit
- High cost
- Weak trust
- Eligibility
- Location
- Product limitations
285. Some Elimination Factors Are Absolute
Examples may include:
- Ineligibility
- Unavailable geography
- Required feature missing
- Unacceptable risk
286. Other Elimination Factors Are Relative
Examples may include:
- Higher cost
- Weaker service
- Lower convenience
- Reduced flexibility
287. Shortlist Size Varies
Some users may retain two providers, while others may compare a wider group.
288. Complex Decisions May Produce Longer Shortlists
Where product suitability is difficult to determine, users may keep several alternatives active for longer.
289. Strong Brand Recognition Can Affect Shortlisting
Familiar brands may benefit from reduced perceived uncertainty.
290. Specialist Relevance Can Offset Lower Brand Familiarity
A less familiar provider may remain competitive where its product or sector fit appears stronger.
291. Trust Can Act as a Tiebreaker
Where two providers appear similar commercially, stronger trust evidence may influence the shortlist.
292. Service Can Act as a Tiebreaker
Support quality, availability or human assistance may differentiate otherwise similar products.
293. Convenience Can Act as a Tiebreaker
A simpler application, stronger app or easier migration process may influence final comparison.
294. Comparison Should Not Be Reduced to “Best”
There may be no universally best provider.
295. Provider Fit Is Contextual
The most appropriate provider depends on the user’s:
- Financial need
- Eligibility
- Risk tolerance
- Budget
- Service expectations
296. Financial SEO Should Reflect Contextual Fit
Content designed solely around superlatives may be less useful than information that helps users determine suitability.
297. Comparison Queries Can Be Highly Commercial
Examples may include:
- Provider A vs Provider B
- Best provider for a specific need
- Alternative to a named provider
- Cheapest provider for a product
298. Comparison Content Requires Strong Governance
Claims about competing providers can become inaccurate quickly.
299. Date Context Can Be Important
Financial comparison content should make freshness sufficiently clear where product terms are time-sensitive.
300. Shortlisting Should Lead Naturally to Final Action
Users who have compared providers successfully should be able to understand how to proceed.
301. Pre-Action Information Needs
Before taking action, users may still want to confirm:
- Eligibility
- Final cost
- Required documents
- Timescale
- Cancellation rights
302. Contact and Application Pathways Should Be Clear
A shortlisted provider should not create unnecessary friction at the point of action.
303. Comparison Stage User Objective
The user’s question becomes:
Which provider offers the strongest combination of product fit, cost, trust, service and practical suitability for my circumstances?
304. Comparison Stage Provider Objective
The provider’s objective is to make its relevant advantages, limitations, costs and suitability sufficiently clear for informed comparison.
305. Comparison Stage Provider Risk
A provider may lose a qualified user despite strong discovery if its product information is difficult to compare, outdated or unclear.
306. Shortlisting Can Be Modelled as a Progressive Filter
The filtering process may be represented as:
Relevant Provider → Trusted Provider → Suitable Product → Competitive Fit → Shortlist
307. The Next Stage Is Selection and Action
Once the shortlist has been established, the financial journey moves into the final stage: choosing a provider, applying, opening an account, purchasing a product or initiating another appropriate action.
Figure 3 : Financial Provider Comparison & Shortlisting Decision Matrix.
308. Stage Seven — Selection and Action
The final stage begins when the user moves from comparison into a concrete financial decision.
309. Selection Is the Outcome of Accumulated Evidence
The final decision reflects information gathered across:
- Need recognition
- Product understanding
- Provider discovery
- Trust validation
- Comparison
310. Selection May Involve an Application
For some products, the next step is a formal application.
311. Selection May Involve Account Opening
Banking, savings or investment journeys may progress into account creation.
312. Selection May Involve Purchase
Insurance or other transactional products may move directly into purchase.
313. Selection May Involve Consultation
More complex financial products may require discussion before commitment.
314. Selection May Involve Business Onboarding
Commercial financial services may require:
- Business verification
- Contract review
- Technical onboarding
- Commercial approval
315. Selection Does Not Always Mean Immediate Completion
A user may choose a preferred provider but still face:
- Eligibility checks
- Identity verification
- Underwriting
- Credit assessment
- Compliance requirements
316. Application Friction Can Change the Final Decision
A user may abandon a preferred provider if the final process becomes unexpectedly difficult.
317. Selection Experience Should Match Pre-Selection Expectations
The provider should avoid creating a sharp gap between marketing promises and operational reality.
318. Final Pricing Should Be Clear
Where applicable, users should understand:
- Final rates
- Fees
- Charges
- Contractual commitments
319. Final Eligibility Should Be Clear
Providers should explain where approval remains subject to further assessment.
320. Final Product Terms Should Be Accessible
Users should be able to review material terms before completing the decision.
321. Final Risk Information Should Remain Visible
Important risk disclosures should not disappear at the moment of conversion.
322. Final Action Should Be Proportionate to Product Complexity
A simple product may support rapid digital completion, while a complex product may require additional guidance or human support.
323. Clear Application Pathways Reduce Unnecessary Friction
Users should understand:
- What happens next
- What documents are required
- How long the process may take
- How progress will be communicated
324. Identity Verification Can Create Friction
Verification steps are often necessary but should be explained clearly.
325. Business Verification Can Create Additional Friction
Business applicants may need to provide:
- Company information
- Ownership information
- Financial records
- Trading history
326. Credit Assessment Can Affect Selection
A preferred product may become unavailable after assessment.
327. Underwriting Can Affect Selection
Insurance and lending decisions may change once detailed risk information is considered.
328. Selection Can Therefore Reopen Comparison
If an application fails, users may return to shortlisted alternatives.
329. The Journey Can Loop Back
A realistic path may be:
Shortlist → Apply → Decline or Change → Recompare → Alternative Selection
330. Financial Selection Is Therefore Dynamic
The final choice can change until the product or relationship is actually established.
331. Provider Communication Matters During Selection
Users may need updates around:
- Application status
- Additional requirements
- Delays
- Approval
- Next steps
332. Silence Can Damage Confidence
Poor communication during onboarding can undermine trust built earlier in the journey.
333. Speed Can Influence Final Selection
Where products are otherwise similar, faster onboarding or approval may become decisive.
334. Speed Should Not Replace Appropriate Controls
Financial providers may still need to complete necessary verification, risk and compliance processes.
335. Human Support Can Influence Final Selection
Complex products may benefit from accessible assistance during the final decision stage.
336. Digital Self-Service Can Influence Final Selection
Other users may strongly prefer:
- Online application
- Instant verification
- Digital document upload
- App-based management
337. Channel Preference Is Contextual
The best conversion path depends on the user’s product, confidence and complexity requirements.
338. Business Customers May Require Procurement
Larger organisations may need:
- Contract review
- Security assessment
- Vendor approval
- Legal review
339. Procurement Can Extend the Selection Journey
Enterprise financial provider selection may continue for weeks or months after initial shortlist creation.
340. Multi-Stakeholder Selection Is Common in Business Finance
Final approval may involve:
- Finance
- Operations
- IT
- Procurement
- Leadership
341. Different Stakeholders Weight Criteria Differently
Finance may prioritise cost while IT prioritises integration and security.
342. Provider Information Should Support Multiple Stakeholders
Complex B2B selection benefits from information that answers both commercial and operational questions.
343. Selection Can Include Negotiation
Commercial financial arrangements may involve negotiation around:
- Pricing
- Contract terms
- Service levels
- Implementation
344. Negotiation Can Change Provider Ranking
A provider initially ranked second may become preferred after commercial discussion.
345. Final Selection Is Not Always the Cheapest Option
Users may accept higher cost in exchange for stronger:
- Trust
- Service
- Flexibility
- Integration
- Operational fit
346. Final Selection Is Not Always the Largest Brand
Specialist providers can win where relevance and service fit are stronger.
347. Final Selection Is Not Always the Most Visible Provider
Visibility creates consideration, but selection depends on deeper evidence.
348. Stage Seven User Objective
The user’s question becomes:
Which provider should I choose, and how do I complete the decision with confidence?
349. Stage Seven Provider Objective
The provider’s objective is to convert qualified consideration into an appropriate completed relationship while maintaining clarity, trust and operational consistency.
350. Stage Seven Provider Risk
A provider can lose a highly qualified user late in the journey because of:
- Application friction
- Unexpected cost
- Poor communication
- Slow onboarding
- Product mismatch
351. Provider Elimination Occurs Throughout the Journey
Financial provider selection is not simply a process of adding candidates.
It is also a process of continual elimination.
352. Early-Stage Elimination
Providers may be removed because they are:
- Not discovered
- Clearly irrelevant
- Unavailable in the market
- Associated with the wrong product
353. Information-Stage Elimination
Providers may lose consideration where information is:
- Confusing
- Outdated
- Incomplete
- Poorly explained
354. Trust-Stage Elimination
Providers may be removed because of:
- Unclear regulation
- Identity conflicts
- Persistent reputation concerns
- Weak transparency
355. Comparison-Stage Elimination
Providers may be removed because of:
- Price
- Features
- Eligibility
- Service
- Practical fit
356. Selection-Stage Elimination
Providers may be removed late because of:
- Application friction
- Changed terms
- Slow response
- Failed eligibility
- Poor onboarding
357. Elimination Can Be Rational and Appropriate
A provider should not seek to prevent users from discovering genuine incompatibility.
358. Good Selection Systems Filter Unsuitable Demand
Clear information can reduce applications from users who are unlikely to qualify or benefit.
359. Appropriate Filtering Can Improve Conversion Quality
Lower raw lead volume may be acceptable where the remaining demand is better aligned with the provider’s actual offer.
360. Elimination Data Can Reveal Strategic Weakness
Recurring loss at one stage may indicate:
- Poor product communication
- Weak trust
- Uncompetitive pricing
- Operational friction
361. Elimination Should Be Measured by Stage
The organisation should distinguish:
- Discovery loss
- Trust loss
- Comparison loss
- Application loss
362. AI Can Influence Every Stage of the Journey
AI-assisted search may influence financial decisions from early education through provider selection.
363. AI at Need Recognition
Users may describe a financial problem conversationally before they understand the relevant product category.
364. AI at Information Discovery
Generated responses may summarise:
- Possible solutions
- Key concepts
- Potential risks
- Next steps
365. AI at Product Understanding
Users may ask for explanations of:
- Rates
- Fees
- Product structures
- Eligibility
- Risk
366. AI at Provider Discovery
Generated answers may introduce providers before any provider website visit occurs.
367. AI at Trust Validation
Users may ask whether an organisation appears:
- Legitimate
- Regulated
- Established
- Reputable
368. AI at Provider Comparison
Users may ask for direct comparisons between products and organisations.
369. AI at Final Selection
Users may ask for a final recommendation based on their stated preferences.
370. AI Can Compress the Journey
Several stages may take place within a single conversational session.
371. AI Compression Can Reduce Website Visits
A user may gather considerable provider information without visiting every relevant website.
372. AI Compression Increases the Importance of Source Clarity
Financial providers need sufficiently clear and current public evidence to support accurate machine synthesis.
373. AI Can Also Increase Verification Behaviour
Users may take provider names from an AI response and then independently check:
- Regulation
- Reviews
- Pricing
- Product details
374. AI Does Not Remove Multi-Source Decision-Making
It changes the interface through which evidence is gathered.
375. AI Provider Selection Should Be Monitored Carefully
Providers may observe:
- Whether they appear
- Whether the appearance is relevant
- Whether descriptions are accurate
- Which sources are visible
376. AI Provider Presence Is Not a Quality Rating
Inclusion should not be treated as independent proof that one provider is better than another.
377. AI Recommendation Order Is Not a Permanent Ranking
Provider order can vary across prompts, models and time.
378. AI Errors Should Be Classified by Materiality
High-impact errors may involve:
- Regulatory identity
- Product availability
- Pricing
- Market availability
- Provider ownership
379. Persistent Material Errors Require Investigation
The provider should examine the wider evidence environment rather than attempting to manipulate one generated response.
380. Financial Provider Selection Continues After Conversion
The initial selection creates an ongoing customer experience.
381. Post-Selection Experience Influences Future Trust
Customers may form views based on:
- Onboarding
- Service
- Support
- Product performance
- Problem resolution
382. Experience Can Become Review Evidence
Customer experiences may later appear in public review environments.
383. Experience Can Become Referral Evidence
Satisfied customers may recommend providers to:
- Friends
- Businesses
- Professional networks
384. Experience Can Become Reputation Risk
Repeated operational problems may generate:
- Negative reviews
- Complaints
- Adverse media coverage
385. Post-Selection Experience Feeds Future Discovery
The customer’s experience can influence what future users discover about the provider.
386. The Financial Selection Feedback Loop
The process can be represented as:
Discovery → Evaluation → Selection → Experience → Feedback → Reputation → Future Discovery
387. Search Authority Is Therefore Partly Operational
Marketing cannot fully control reputation signals created by real customer experience.
388. Product Teams Influence Search Authority
Product quality and clarity can affect:
- Reviews
- Comparison performance
- Retention
- Recommendations
389. Customer Service Influences Search Authority
Support experiences can shape public trust evidence.
390. Complaints Handling Influences Search Authority
How problems are resolved may affect reputation and future provider consideration.
391. Financial SEO Should Therefore Connect with Operations
The strongest provider-selection strategy connects:
Search + Product + Trust + Customer Experience + Measurement
392. The Full Seven-Stage Provider Selection Journey
The entire model can now be represented as:
Need Recognition → Information Discovery → Product Understanding → Provider Discovery → Trust Validation → Provider Comparison → Selection & Action
393. The Journey Continues Beyond Selection
The full lifecycle extends into:
Selection → Experience → Feedback → Reputation → Future Selection
394. Search and AI Influence Both Ends of the Loop
Search systems help users discover providers, while public post-selection evidence can later shape search and AI representations.
395. The Model Is Therefore Circular Rather Than Purely Linear
Every customer experience can contribute indirectly to the evidence environment facing future users.
396. The Next Stage Is Measurement
The provider-selection model now needs a stage-by-stage measurement system capable of identifying where users discover, evaluate, eliminate, shortlist and select financial providers.
Figure 4 : Financial Provider Elimination, AI Influence & Post-Selection Feedback Loop.
397. Measuring the Financial Provider Selection Journey
The Financial Provider Selection Model becomes operational when the organisation can measure how users progress through each stage of discovery, evaluation, trust validation, comparison and final action.
398. Measurement Should Follow the Seven-Stage Journey
A useful measurement structure examines:
- Financial Need Recognition
- Information Discovery
- Product Understanding
- Provider Discovery
- Trust Validation
- Provider Comparison
- Selection and Action
399. Measurement Should Not Begin and End with Conversion
A final application or account opening reveals only the last visible outcome of a much longer decision process.
400. Stage One Measurement — Financial Need Recognition
The first stage should measure whether the provider participates in problem-led and goal-led financial search behaviour.
401. Need-Recognition Search Visibility
Potential indicators include visibility around:
- Financial problems
- Financial goals
- Cost concerns
- Risk concerns
- Early eligibility questions
402. Need-Recognition Query Coverage
Assess whether the provider covers enough of the language users employ before they know the formal product category.
403. User-Language Coverage
Monitor whether content reflects both:
- Everyday financial language
- Formal product terminology
404. Early-Stage Organic Visibility
Track relevant non-branded impressions and visits around early financial questions.
405. Early-Stage AI Visibility
Observe whether selected AI systems associate the provider or its information with relevant financial problem categories.
406. Early-Stage Engagement
Potential measures include:
- Guide engagement
- Scroll depth
- Movement to product information
- Use of calculators or tools
407. Need-to-Product Progression
Measure whether users move from problem-oriented content toward appropriate product categories.
408. Stage One Diagnostic Question
The organisation should ask:
Are we discoverable where relevant financial needs begin, or only after the user already knows the product?
409. Stage Two Measurement — Information Discovery
The second stage measures whether the provider participates across the main environments users rely on for financial research.
410. Organic Discovery Metrics
Potential indicators include:
- Non-branded search visibility
- Informational traffic
- Entry-page distribution
- Topic coverage
411. AI Discovery Metrics
Potential observations include:
- Provider presence
- Product-category association
- Description accuracy
- Visible source patterns
412. Comparison-Platform Discovery
Where relevant, monitor whether priority products are represented accurately across comparison environments.
413. Editorial Discovery
Monitor relevant appearances in:
- Financial media
- Industry publications
- Independent reviews
- Expert commentary
414. Regulatory Discovery
Assess whether official and regulatory information supports a clear understanding of provider identity where applicable.
415. Referral-Led Discovery
Where possible, intake or onboarding processes may capture whether users arrived through:
- Professional recommendation
- Accountant referral
- Adviser referral
- Customer referral
416. Discovery Source Diversity
A stronger discovery profile may involve multiple relevant environments rather than dependence on one channel.
417. Discovery Accuracy
Measure whether material provider information is consistent across the main sources users are likely to encounter.
418. Discovery Conflict Rate
Track material conflicts involving:
- Provider identity
- Product availability
- Pricing
- Market availability
- Regulatory relationships
419. Stage Two Diagnostic Question
The organisation should ask:
Across which discovery environments do users encounter us, and is the provider represented consistently enough to remain credible?
420. Stage Three Measurement — Product Understanding
The third stage measures whether users can understand the product well enough to make an informed next decision.
421. Product-Page Engagement
Potential indicators include:
- Product-page visits
- Time on product information
- Feature interaction
- Pricing engagement
- FAQ engagement
422. Eligibility Engagement
Measure whether users interact with:
- Eligibility information
- Qualification tools
- Pre-check processes
- Application criteria
423. Pricing and Fee Engagement
Assess whether users can locate and understand the main cost structure.
424. Product-Comparison Tool Usage
Track use of:
- Calculators
- Comparison tables
- Scenario tools
- Product selectors
425. Product-to-Provider Progression
Measure whether users move from product education toward provider evaluation.
426. Product Understanding Abandonment
High abandonment at this stage may indicate:
- Complex information
- Unclear eligibility
- Poor pricing transparency
- Insufficient explanation
427. Unsuitable User Filtering
Some abandonment may be positive where clear information prevents unsuitable applications.
428. Measure Quality, Not Only Volume
A smaller group of better-informed users may be commercially more valuable than a larger group of poorly qualified visitors.
429. Stage Three Diagnostic Question
The organisation should ask:
Can users understand our products sufficiently well to decide whether deeper provider evaluation is worthwhile?
430. Stage Four Measurement — Provider Discovery
The fourth stage measures whether the organisation enters the user’s active provider consideration set.
431. Non-Branded Provider Visibility
Monitor visibility for relevant provider-category queries.
432. Branded Search Growth
Changes in branded search may indicate growing awareness, although attribution should be interpreted carefully.
433. AI Provider Presence
Track whether the provider appears in relevant:
- Product prompts
- Audience prompts
- Local prompts
- Comparison prompts
434. AI Provider Relevance
Presence should be assessed for whether it matches the correct:
- Product
- Market
- Audience
- Geography
435. Comparison-Platform Visibility
Where applicable, monitor:
- Product presence
- Positioning
- Pricing accuracy
- Feature accuracy
436. Editorial Provider Discovery
Measure whether relevant independent sources identify the organisation for the product categories it genuinely serves.
437. Provider Discovery by Audience
Separate performance where appropriate across:
- Consumers
- SMEs
- Enterprise
- Specialist segments
438. Provider Discovery by Geography
Measure whether provider consideration differs across:
- Markets
- Regions
- Countries
- Local areas
439. Stage Four Diagnostic Question
The organisation should ask:
Are we entering the right provider consideration sets for the right users and financial needs?
440. Stage Five Measurement — Trust Validation
The fifth stage measures whether users encounter enough credible evidence to retain the provider in consideration.
441. Regulatory Validation Metrics
Where applicable, monitor:
- Regulatory information visibility
- Identity accuracy
- Legal-entity clarity
- Official-source consistency
442. Branded Trust Searches
Users may search for combinations involving:
- Reviews
- Complaints
- Regulation
- Safety
- Legitimacy
443. Branded Trust Search Volume
The pattern of these queries can provide insight into what users seek to verify.
444. Review Metrics
Potential indicators include:
- Review volume
- Review recency
- Review themes
- Response patterns
445. Review Ratings Require Context
Averages should not be treated as complete measures of trust or product quality.
446. Complaint Theme Analysis
Monitor recurring issues involving:
- Support
- Fees
- Claims
- Onboarding
- Account access
447. Trust Content Engagement
Track engagement with:
- Security information
- Legal information
- Privacy information
- Customer support
- Regulatory disclosures
448. AI Trust Accuracy
Monitor whether generated systems describe material trust information accurately.
449. Trust-Stage Material AI Errors
Priority errors may involve:
- Regulatory identity
- Ownership
- Security claims
- Provider status
450. Trust-to-Comparison Progression
Where measurable, assess whether users continue from trust validation toward product comparison or application.
451. Stage Five Diagnostic Question
The organisation should ask:
What evidence causes users to retain or eliminate us after initial provider discovery?
452. Stage Six Measurement — Provider Comparison
The sixth stage measures how the provider performs when users compare alternatives directly.
453. Comparison-Page Engagement
Track user interaction with:
- Pricing
- Features
- Eligibility
- Comparison tables
- Product selectors
454. Competitor Comparison Search Visibility
Where relevant, monitor queries involving:
- Provider comparisons
- Alternatives
- Best-provider searches
- Product comparisons
455. AI Comparison Presence
Track whether the organisation appears in relevant generated provider comparisons.
456. AI Comparison Accuracy
Assess whether descriptions of:
- Products
- Features
- Pricing
- Markets
- Limitations
remain accurate.
457. Shortlist Progression
Where measurable, identify whether users move from product comparison toward application, consultation or account opening.
458. Comparison-Stage Abandonment
Potential causes may include:
- Price disadvantage
- Missing features
- Weak support
- Poor eligibility fit
- Switching friction
459. Competitive Loss Reasons
Sales, onboarding or customer-facing teams may capture recurring reasons users select alternatives.
460. Comparison Outcome Quality
The organisation should distinguish between:
- Loss because of poor fit
- Loss because of avoidable weakness
461. Stage Six Diagnostic Question
The organisation should ask:
When users compare us seriously, which factors help us remain on the shortlist and which factors remove us?
462. Stage Seven Measurement — Selection and Action
The final stage measures whether shortlisted users progress into an appropriate completed financial relationship.
463. Application Start Rate
Measure how many qualified users begin the next formal step.
464. Application Completion Rate
Track how many users who begin an application complete it.
465. Account Opening Completion
Where applicable, measure successful account establishment.
466. Consultation Booking Rate
For advice-led or complex products, monitor progression into meaningful consultation.
467. Qualified Application Rate
Distinguish raw application volume from users who genuinely meet relevant criteria.
468. Decline Rate
Where appropriate, monitor how often applications do not proceed because of:
- Eligibility
- Credit
- Underwriting
- Compliance
- Risk
469. Decline Reason Analysis
This can reveal whether the earlier journey is attracting unsuitable demand.
470. Application Abandonment Rate
Track where users leave the formal application process.
471. Application Friction Analysis
Potential causes may include:
- Too many steps
- Unclear documentation requirements
- Unexpected conditions
- Technical errors
- Slow verification
472. Time to Approval
Where relevant, measure elapsed time between application and decision.
473. Time to Onboarding
Measure how long it takes approved users to become fully operational customers.
474. Support Contact During Application
High support demand may indicate application complexity or unclear information.
475. Selection-to-Activation Rate
For some products, approval alone is not the final outcome.
Measure whether users actually activate or begin using the product.
476. Selection-to-Retention Measurement
Where appropriate, early retention may help reveal whether expectations created during selection match the actual product experience.
477. Stage Seven Diagnostic Question
The organisation should ask:
Once a user selects us, what prevents an appropriate financial relationship from being completed successfully?
478. Stage-to-Stage Conversion Measurement
The provider-selection journey can be measured as a sequence of transitions.
479. Need-to-Information Progression
Measure whether relevant early-stage users engage with deeper financial information.
480. Information-to-Product Progression
Measure whether users move from general education into relevant product evaluation.
481. Product-to-Provider Progression
Measure whether users move from understanding a product category toward evaluating the organisation specifically.
482. Provider-to-Trust Progression
Measure whether users seek or engage with trust evidence after provider discovery.
483. Trust-to-Comparison Progression
Measure whether validated users continue toward active comparison.
484. Comparison-to-Action Progression
Measure whether shortlisted users move toward application, account opening, consultation or purchase.
485. Action-to-Completion Progression
Measure whether initiated processes reach an appropriate final outcome.
486. Example Journey Funnel
A simplified measurement path may be:
Information → Product → Provider → Trust → Comparison → Application → Completion
487. Funnel Loss Should Be Diagnosed, Not Merely Reported
A falling conversion rate is only useful if the organisation understands why users are leaving.
488. Abandonment Should Be Classified by Stage
Potential categories include:
- Information abandonment
- Product abandonment
- Trust abandonment
- Comparison abandonment
- Application abandonment
489. Good Abandonment and Bad Abandonment
Not all loss represents failure.
490. Good Abandonment
Examples may include:
- Ineligible users self-selecting out
- Unsuitable product users leaving early
- Unavailable market users being filtered
491. Bad Abandonment
Examples may include:
- Suitable users confused by pricing
- Trusted users blocked by technical friction
- Qualified users unable to obtain support
492. Qualified Conversion Matters More Than Raw Conversion
The objective is not maximum progression from every visitor.
It is stronger progression among users genuinely suited to the product or provider.
493. Attribution Across the Financial Journey
A single provider-selection journey may involve several discovery environments.
494. First-Touch Attribution
This helps identify where provider awareness first began.
495. Last-Touch Attribution
This identifies the final measurable interaction before application or purchase.
496. Assisted Attribution
This can help recognise intermediate influences such as:
- Comparison platforms
- AI assistants
- Reviews
- Financial media
- Regulatory checks
497. Example AI-Assisted Journey
A journey may look like:
AI Answer → Product Guide → Comparison Site → Provider Website → Review Search → Application
498. Example Search-Led Journey
A journey may look like:
Google Search → Financial Guide → Product Page → Provider Comparison → Application
499. Example Referral-Led Journey
A journey may look like:
Accountant Referral → Branded Search → Regulatory Verification → Provider Website → Consultation
500. Financial Attribution Will Remain Imperfect
Offline influence, device switching and closed AI environments can limit complete measurement.
501. Self-Reported Discovery Can Add Context
Application or onboarding processes may ask users how they heard about the provider where appropriate.
502. Self-Reported Discovery Has Limitations
Users may remember the most recent source rather than the first or most influential one.
503. AI Attribution Requires Triangulation
Potential signals may include:
- Identifiable referral traffic
- Self-reported AI discovery
- Branded-search changes
- Observed AI provider presence
504. Source Attribution Should Not Be Overstated
The organisation should avoid claiming precise causal relationships where the evidence does not support them.
505. Evidence Confidence Should Accompany Journey Metrics
Each important measurement should indicate how reliable the underlying evidence is.
506. High-Confidence Evidence
Data is direct, current and sufficiently complete.
507. Medium-Confidence Evidence
Data is useful but incomplete or dependent on reasonable inference.
508. Low-Confidence Evidence
Data is sparse, indirect or difficult to validate.
509. Journey Metrics Should Be Segmented
Whole-business averages may conceal major differences between financial products.
510. Segment by Product
Measure the journey separately where appropriate for:
- Mortgages
- Insurance
- Investments
- Payments
- Business finance
511. Segment by Audience
Compare:
- Consumer
- SME
- Enterprise
- Specialist customer groups
512. Segment by Geography
Compare provider-selection behaviour across relevant markets or regions.
513. Segment by Acquisition Source
Different users may behave differently depending on whether they arrive through:
- Organic search
- AI
- Comparison sites
- Paid media
- Referrals
514. Segment by New and Existing Customers
Existing relationships can change the amount of trust validation required.
515. Executive Financial Provider Selection Scorecard
| Journey Stage | Primary Measure | Confidence | Trend | Priority |
|---|---|---|---|---|
| Need Recognition | Early-stage relevance & progression | Low / Medium / High | Improving / Stable / At Risk / Regressing | Critical / High / Medium / Low |
| Information Discovery | Discovery coverage & accuracy | Low / Medium / High | Improving / Stable / At Risk / Regressing | Critical / High / Medium / Low |
| Product Understanding | Product clarity & suitable progression | Low / Medium / High | Improving / Stable / At Risk / Regressing | Critical / High / Medium / Low |
| Provider Discovery | Relevant provider consideration | Low / Medium / High | Improving / Stable / At Risk / Regressing | Critical / High / Medium / Low |
| Trust Validation | Trust retention & material conflicts | Low / Medium / High | Improving / Stable / At Risk / Regressing | Critical / High / Medium / Low |
| Provider Comparison | Shortlist progression & loss reasons | Low / Medium / High | Improving / Stable / At Risk / Regressing | Critical / High / Medium / Low |
| Selection & Action | Qualified completion & onboarding | Low / Medium / High | Improving / Stable / At Risk / Regressing | Critical / High / Medium / Low |
516. Scorecards Should Show the Weakest Journey Stage
A strong acquisition programme can still underperform if one critical stage causes disproportionate user loss.
517. Scorecards Should Show Critical Errors
Material regulatory, pricing or provider-identity issues should remain separately visible rather than disappearing into aggregate averages.
518. Scorecards Should Show Evidence Confidence
Leadership needs to understand whether conclusions are strongly verified or based on limited evidence.
519. Scorecards Should Show Trend
A currently strong stage may still require attention if it is deteriorating.
520. Scorecards Should Lead to Action
Each diagnostic finding should connect to:
- Owner
- Priority
- Required action
- Success measure
521. Measurement Should Identify Journey Bottlenecks
A bottleneck occurs where an otherwise qualified user population experiences disproportionate loss.
522. Discovery Bottleneck
The organisation may have strong products but weak provider visibility.
523. Trust Bottleneck
The provider may be discovered but fail to generate sufficient confidence.
524. Comparison Bottleneck
The provider may survive trust validation but lose because of:
- Pricing
- Features
- Service
- Practical fit
525. Application Bottleneck
Qualified users may select the provider but fail to complete onboarding.
526. Measurement Should Distinguish Visibility from Selection
High visibility does not automatically mean high provider preference.
527. Measurement Should Distinguish Selection from Completion
A user can prefer a provider but still fail to complete the application.
528. Measurement Should Distinguish Completion from Satisfaction
A completed product relationship can still produce poor downstream customer experience.
529. The Full Measurement Chain
The financial provider-selection measurement system can be represented as:
Discover → Understand → Consider → Trust → Compare → Select → Complete → Experience
530. The Next Stage Is Continuous Improvement
Once the journey is measured, the organisation can use user behaviour, product changes, trust evidence, external sources and AI observations to improve the provider-selection system continuously.
Figure 5 : Financial Provider Selection Measurement & Journey Diagnostic Scorecard.
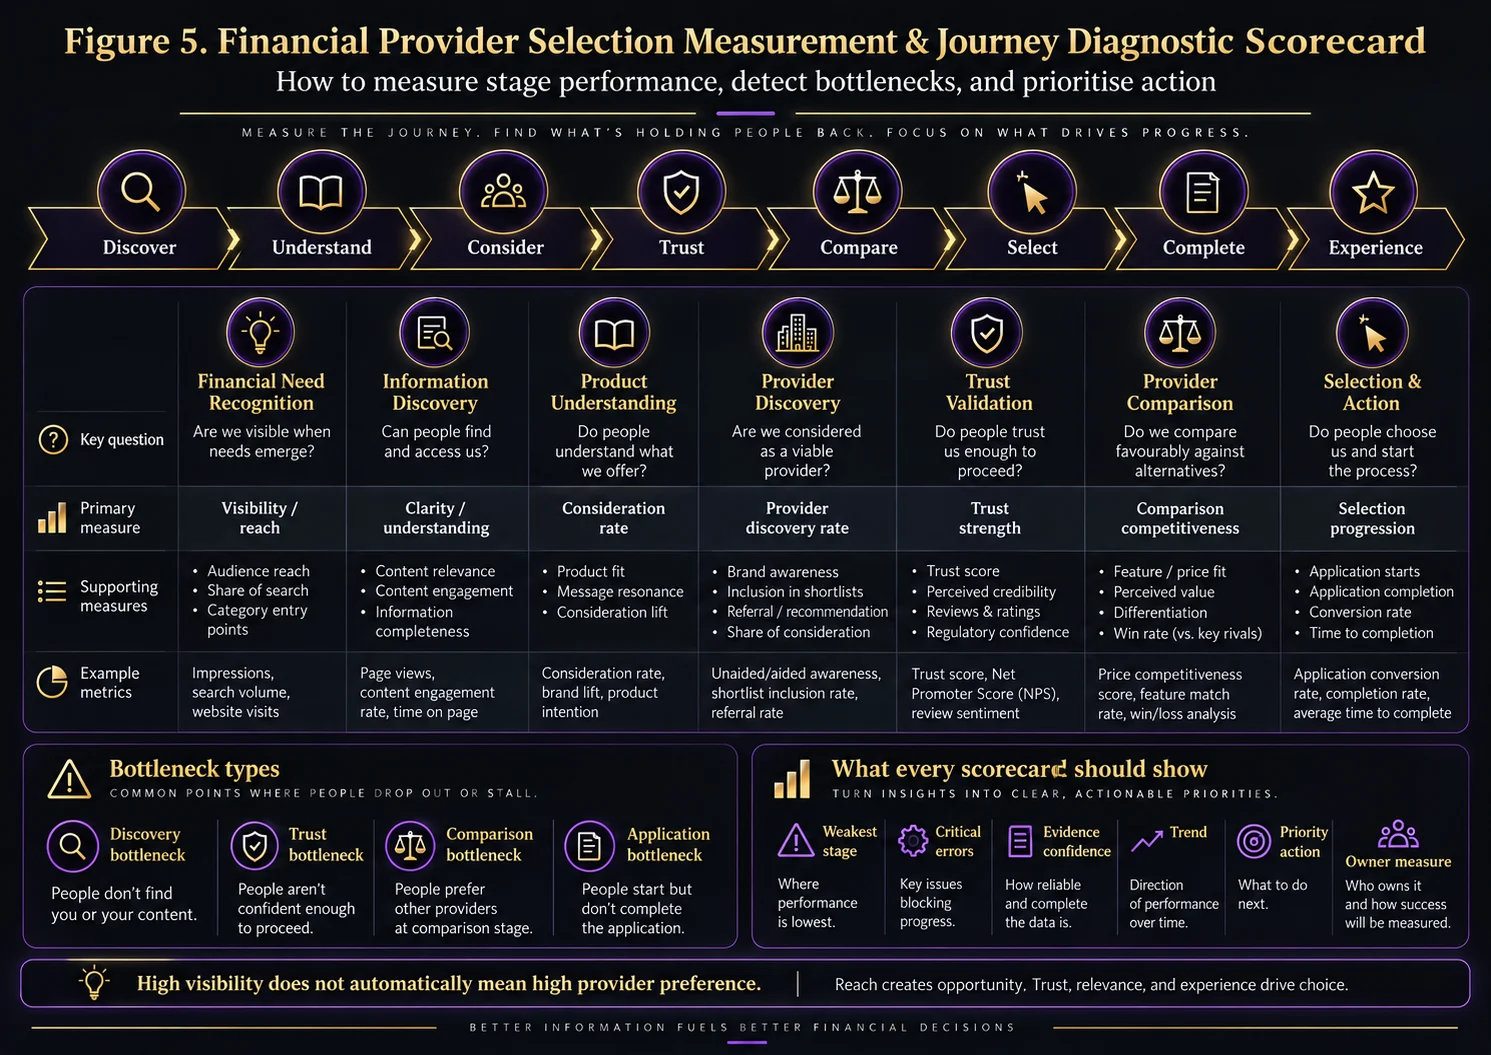
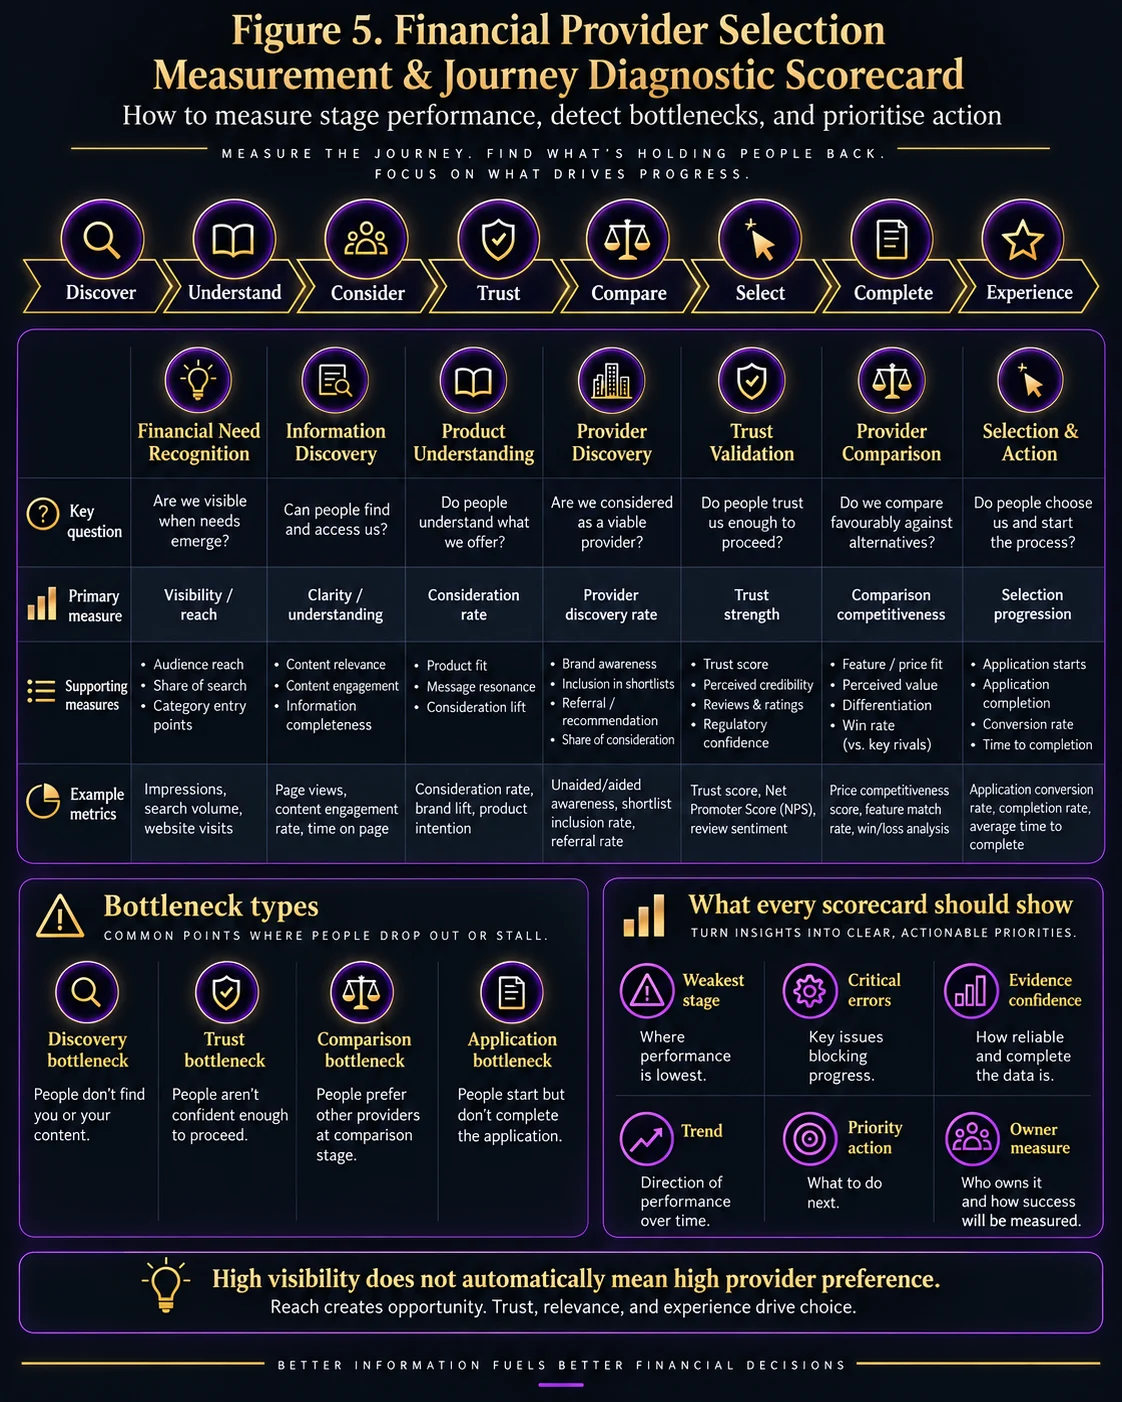
531. Continuous Improvement of the Provider Selection Journey
Financial provider selection is not static. User behaviour, product terms, regulation, market conditions, reputation evidence and AI-assisted discovery can all change over time.
532. A Strong Journey Today Can Weaken Tomorrow
Provider-selection performance may decline if the organisation fails to maintain:
- Product accuracy
- Trust evidence
- Discovery visibility
- Operational quality
- AI representation
533. Continuous Improvement Should Be Evidence-Led
The organisation should use measurement to identify where the journey is weakening and why.
534. Begin with Stage-Level Diagnosis
When performance declines, first identify the affected stage:
- Need Recognition
- Information Discovery
- Product Understanding
- Provider Discovery
- Trust Validation
- Provider Comparison
- Selection and Action
535. Then Identify the Underlying Cause
Potential causes may include:
- Search visibility loss
- Product changes
- Pricing changes
- Trust deterioration
- Operational friction
- External misinformation
536. Improvement Should Address the Cause, Not Only the Symptom
A traffic decline, for example, may reflect a deeper product or provider relevance issue rather than a purely technical SEO problem.
537. Product Evidence Can Decay
Financial product information becomes less reliable when:
- Rates change
- Fees change
- Terms change
- Products are withdrawn
- Eligibility changes
538. Product Freshness Should Be Monitored
High-priority financial information should have defined review and update triggers.
539. Provider Identity Can Decay
Rebrands, acquisitions or legal-entity changes may create conflicting representations across the wider web.
540. Brand Architecture Can Become Confusing
Users may struggle to understand the relationship between:
- Brand
- Parent company
- Legal entity
- Regulated entity
541. Trust Evidence Can Decay
Regulatory, security and reputation information can become outdated or inconsistent.
542. Review Evidence Can Drift
The themes and recency of customer feedback can change significantly over time.
543. Editorial Evidence Can Decay
Old reviews or articles may continue to influence users after product terms have changed.
544. Comparison Evidence Can Decay
Third-party platforms may retain old:
- Rates
- Fees
- Features
- Provider descriptions
545. Search Visibility Can Drift
A provider may lose visibility as search behaviour, competitors and result formats change.
546. AI Representation Can Drift
Generated descriptions may change even when the provider has not altered its own information.
547. AI Drift Can Result from Source Change
New external information may influence machine-generated summaries.
548. AI Drift Can Result from Model Change
Different models or retrieval methods may interpret the same evidence differently.
549. AI Drift Can Result from Product Change
Rapidly changing financial products create a particular risk of stale generated information.
550. Not Every AI Variation Requires Intervention
The organisation should distinguish between:
- Minor wording variation
- Temporary output variation
- Persistent material error
551. Persistent Material Errors Should Trigger Diagnosis
Priority errors may involve:
- Regulatory identity
- Product availability
- Pricing
- Eligibility
- Market coverage
552. User Behaviour Can Change
Financial search behaviour evolves as users adopt new:
- Apps
- Comparison tools
- AI assistants
- Payment methods
- Financial products
553. Query Language Can Change
Users may move from short keyword searches toward more conversational and scenario-led questions.
554. Conversational Search Can Combine Multiple Stages
One prompt may include:
- Need
- Product
- Comparison
- Trust
555. Content Strategy Should Adapt to Query Change
Financial providers should monitor how users describe problems and decisions rather than relying only on historic keyword structures.
556. Provider Selection Failure Modes
Several recurring patterns can weaken the financial selection journey.
557. Failure Mode — Optimising Only for Product Keywords
This may ignore earlier problem and information stages where provider consideration begins.
558. Failure Mode — Optimising Discovery Without Trust
High visibility may fail to convert if regulatory, reputation or identity evidence is weak.
559. Failure Mode — Optimising Trust Without Product Clarity
A trusted organisation can still lose users if its product is difficult to understand.
560. Failure Mode — Optimising Product Clarity Without Comparison Readiness
Users may understand the product but still prefer competitors if differences are difficult to evaluate.
561. Failure Mode — Optimising Comparison Without Application Experience
A provider can win the shortlist and still lose the user during onboarding.
562. Failure Mode — Treating All Traffic as Equal
Financial providers should distinguish relevant users from:
- Ineligible users
- Out-of-market users
- Low-intent informational users
- Unsuitable product users
563. Failure Mode — Measuring Leads Without Qualification
Higher application or enquiry volume may not indicate better provider-selection performance.
564. Failure Mode — Hiding Eligibility
Weak eligibility information can create unnecessary applications and later rejection.
565. Failure Mode — Hiding Cost Complexity
Unexpected charges late in the journey can undermine trust.
566. Failure Mode — Overemphasising Headline Rates
Users may lose confidence where headline pricing does not reflect the likely overall cost.
567. Failure Mode — Weak Product Freshness
Outdated rates or features can affect:
- Search results
- Comparison sites
- AI summaries
- User trust
568. Failure Mode — Inconsistent Brand Identity
Different brand, company and regulated-entity names may confuse users if relationships are poorly explained.
569. Failure Mode — Regulation Treated as Marketing Copy
Regulatory information should be represented accurately rather than used as vague promotional language.
570. Failure Mode — Review Scores Treated as Financial Quality Scores
Reviews may reflect customer experience but do not necessarily establish suitability, financial strength or product quality.
571. Failure Mode — Comparison Platform Dependence
Heavy dependence on one commercial platform can weaken discovery resilience.
572. Failure Mode — Search Dependence
A provider reliant on traditional organic search alone may miss users researching through AI, referrals or comparison environments.
573. Failure Mode — AI Presence Treated as Success
Frequent generated visibility is not useful if provider descriptions are inaccurate or irrelevant.
574. Failure Mode — Recommendation Order Treated as Ranking
The sequence of providers in one generated response should not be treated as a stable market ranking.
575. Failure Mode — One AI Prompt Becomes the KPI
A robust monitoring programme should use repeatable prompt groups and longitudinal observation.
576. Failure Mode — Chasing AI Outputs Directly
The provider should strengthen the underlying evidence environment rather than attempt to engineer one specific generated response.
577. Failure Mode — Ignoring Source Conflicts
Persistent differences between provider, comparison, regulatory and editorial information can increase decision friction.
578. Failure Mode — Measuring Only Last Click
The final direct or organic visit may conceal earlier influence from:
- AI
- Comparison platforms
- Reviews
- Professional referrals
579. Failure Mode — Ignoring Offline Influence
Accountants, advisers, brokers and peer recommendations may strongly influence financial provider selection.
580. Failure Mode — Ignoring Product Teams
Search and provider-selection performance may deteriorate when marketing is disconnected from changing product reality.
581. Failure Mode — Ignoring Customer Service
Operational experience generates review and referral evidence that later influences discovery.
582. Failure Mode — Ignoring Complaints
Recurring complaints may expose systemic issues that eventually affect reputation and trust.
583. Failure Mode — Treating All Abandonment as Negative
Some user loss reflects appropriate qualification and filtering.
584. Failure Mode — Treating All Conversion as Positive
Poorly matched users may convert initially and then produce:
- Declines
- Cancellations
- Complaints
- Poor retention
585. Failure Mode — No Stage Ownership
Journey weaknesses may persist where no team is clearly responsible for improving them.
586. Stage Ownership Should Be Cross-Functional
Different parts of the journey may involve:
- SEO
- Content
- Product
- Compliance
- Customer service
- Analytics
587. Need Recognition Ownership
SEO, content and product teams may collaborate to understand problem-led search demand.
588. Product Understanding Ownership
Product and content teams may work together to maintain accurate financial information.
589. Trust Validation Ownership
Marketing, compliance, customer service and reputation teams may all contribute.
590. Comparison Ownership
Product, pricing, marketing and analytics teams may need to collaborate.
591. Selection and Action Ownership
Digital, operations, onboarding and support teams may influence final completion.
592. Improvement Should Use Multiple Evidence Sources
A strong diagnostic system combines:
Search Data + Website Behaviour + Product Data + Intake Data + Customer Feedback + AI Observation
593. Search Data Reveals Discovery
Search visibility can show whether users are encountering relevant content and provider pages.
594. Website Behaviour Reveals Progression
On-site activity can reveal movement between:
- Information
- Products
- Trust
- Applications
595. Product Data Reveals Suitability and Outcomes
Eligibility, decline and activation data can reveal whether the earlier journey is attracting the right users.
596. Intake Data Reveals Selection Context
Applications or enquiries may provide information about:
- Need
- Source
- Eligibility
- Product interest
597. Customer Feedback Reveals Experience
Reviews, surveys and support data can expose downstream strengths and weaknesses.
598. AI Observation Reveals Representation
Repeated prompt monitoring can show whether machine-mediated provider representation is:
- Relevant
- Accurate
- Stable
599. Continuous Improvement Requires Prioritisation
Not every journey weakness should receive equal attention.
600. Prioritise Material Accuracy First
Correct errors involving:
- Regulation
- Pricing
- Eligibility
- Product availability
- Provider identity
601. Prioritise Major Journey Bottlenecks Second
Focus on stages where suitable users are lost disproportionately.
602. Prioritise Strategic Products Third
High-value or high-growth products may justify greater optimisation once critical issues are controlled.
603. Prioritise High-Confidence Findings
Actions supported by strong evidence may be implemented sooner than speculative changes.
604. Investigate Low-Confidence Findings
Where the cause is uncertain, gather more evidence before making major changes.
605. Improve the Underlying Capability
Recurring failure should trigger process improvement rather than repeated one-off fixes.
606. Example Product Freshness Improvement
If outdated rates repeatedly appear, strengthen update governance across:
- Product pages
- Comparison feeds
- Editorial updates
- Structured data
607. Example Provider Identity Improvement
If brand and legal entity confusion recurs, improve the organisation’s entity architecture.
608. Example Trust Improvement
If users repeatedly search for legitimacy or safety, strengthen clear, verifiable trust evidence.
609. Example Comparison Improvement
If users consistently lose confidence around pricing, improve total-cost clarity rather than adding more promotional claims.
610. Example Application Improvement
If qualified users abandon onboarding, improve the process rather than simply increasing acquisition traffic.
611. Example AI Improvement
If persistent generated errors occur, investigate the relevant evidence sources and conflicts.
612. Verify Improvements Against the Baseline
After changes, compare the updated journey with the previous measurement state.
613. Improvement Should Increase Qualified Progression
Useful improvement may result in:
- Better relevant discovery
- Clearer product understanding
- Stronger trust retention
- More appropriate shortlisting
- Higher qualified completion
614. Improvement Should Reduce Avoidable Friction
Potential reductions may include:
- Confusion
- Unexpected costs
- Technical problems
- Slow onboarding
- Support failure
615. Some Friction Is Necessary
Financial services may require appropriate verification and suitability controls.
616. Good Friction
Examples may include:
- Identity verification
- Eligibility assessment
- Risk assessment
- Required disclosures
617. Bad Friction
Examples may include:
- Broken forms
- Repeated information requests
- Unclear instructions
- Unnecessary application steps
618. Continuous Improvement Should Protect Trust
Conversion optimisation should not remove information or controls necessary for informed financial decisions.
619. Continuous Improvement Should Protect Accuracy
Simplification should not create misleading product or pricing claims.
620. Continuous Improvement Should Protect Suitability
Providers should not design journeys solely to maximise completion regardless of user fit.
621. Continuous Improvement Should Support User Understanding
The strongest provider-selection journey helps users make better-informed decisions.
622. Continuous Improvement Should Support Commercial Quality
Better-informed users may produce:
- More appropriate applications
- Better activation
- Stronger retention
- Lower avoidable support demand
623. Continuous Improvement Should Feed Product Strategy
Repeated comparison losses can reveal weaknesses in the product itself rather than in marketing alone.
624. Continuous Improvement Should Feed Service Strategy
Customer feedback can reveal operational factors affecting provider selection and retention.
625. Continuous Improvement Should Feed Trust Strategy
Recurring verification behaviour may show where users need stronger independent evidence.
626. Continuous Improvement Should Feed AI Readiness
Repeated machine-generated inaccuracies can expose areas where the wider evidence environment remains unclear.
627. The Continuous Financial Provider Selection Cycle
A practical improvement cycle is:
Observe → Verify → Diagnose → Prioritise → Improve → Measure → Learn → Reassess
628. Observe
Monitor the seven-stage provider journey.
629. Verify
Confirm whether apparent problems are current, material and supported by evidence.
630. Diagnose
Identify the stage and underlying cause of the weakness.
631. Prioritise
Rank action according to:
- Risk
- User impact
- Commercial importance
- Evidence confidence
632. Improve
Change the underlying content, product, trust, operational or evidence system.
633. Measure
Compare the post-change journey with the previous baseline.
634. Learn
Use recurring patterns to improve standards and operating processes.
635. Reassess
Repeat the journey analysis as market conditions and user behaviour change.
636. The Cycle Should Operate by Product
A provider may run separate improvement cycles for:
- Mortgages
- Insurance
- Payments
- Investments
- Business finance
637. The Cycle Should Operate by Audience
Consumer, SME and enterprise journeys may require different optimisation priorities.
638. The Cycle Should Operate by Market
Financial providers operating across multiple jurisdictions should reflect local differences in:
- Products
- Regulation
- User expectations
- Search behaviour
639. The Cycle Should Operate Across Search and AI
Traditional search and AI-assisted discovery should be analysed as connected parts of one provider-selection environment.
640. The Journey Should Be Reassessed After Major Product Changes
Significant changes to:
- Pricing
- Eligibility
- Features
- Terms
may alter user behaviour throughout the selection process.
641. Reassess After Brand Changes
Rebrands or acquisitions may change provider identity and trust behaviour.
642. Reassess After Regulatory Changes
Changes in regulatory context may alter user information and validation needs.
643. Reassess After Major Reputation Events
Significant customer, media or public issues may affect trust thresholds.
644. Reassess After AI Platform Changes
Major changes in generative search behaviour may affect discovery and comparison patterns.
645. Reassess After Significant Competitor Change
New providers, product launches or aggressive pricing changes may alter comparison behaviour.
646. Reassessment Should Update the Journey Scorecard
The organisation should revise:
- Stage performance
- Evidence confidence
- Trend
- Priority actions
647. The Model Connects Acquisition and Customer Experience
Provider selection begins before conversion and continues to influence reputation after conversion.
648. The Model Connects Product and Marketing
Marketing can create visibility, but product suitability strongly influences comparison and completion.
649. The Model Connects Trust and Operations
Trust is shaped both by public evidence and by real customer experience.
650. The Model Connects Search and AI
Both environments influence how users discover, understand and compare financial providers.
651. The Model Connects Selection and Reputation
Today’s customer experience becomes part of tomorrow’s provider evidence.
652. The Complete Financial Provider Selection System
The full model can therefore be represented as:
Need → Discover → Understand → Find Provider → Validate Trust → Compare → Select → Experience → Feedback → Future Discovery
653. The Strategic Objective
The purpose of the model is not simply to maximise financial visibility.
It is to help providers understand how relevant users move from financial need to informed provider selection.
654. The Final Improvement Principle
A resilient financial provider-selection strategy should aim to improve:
Relevance + Clarity + Trust + Comparison Readiness + Qualified Progression + Experience
655. The Next Step Is Strategic Integration
The final section will consolidate the model’s strategic implications, methodology, limitations, related Financial Services frameworks and research usage guidance.
Figure 6 : Continuous Financial Provider Selection Improvement Cycle.
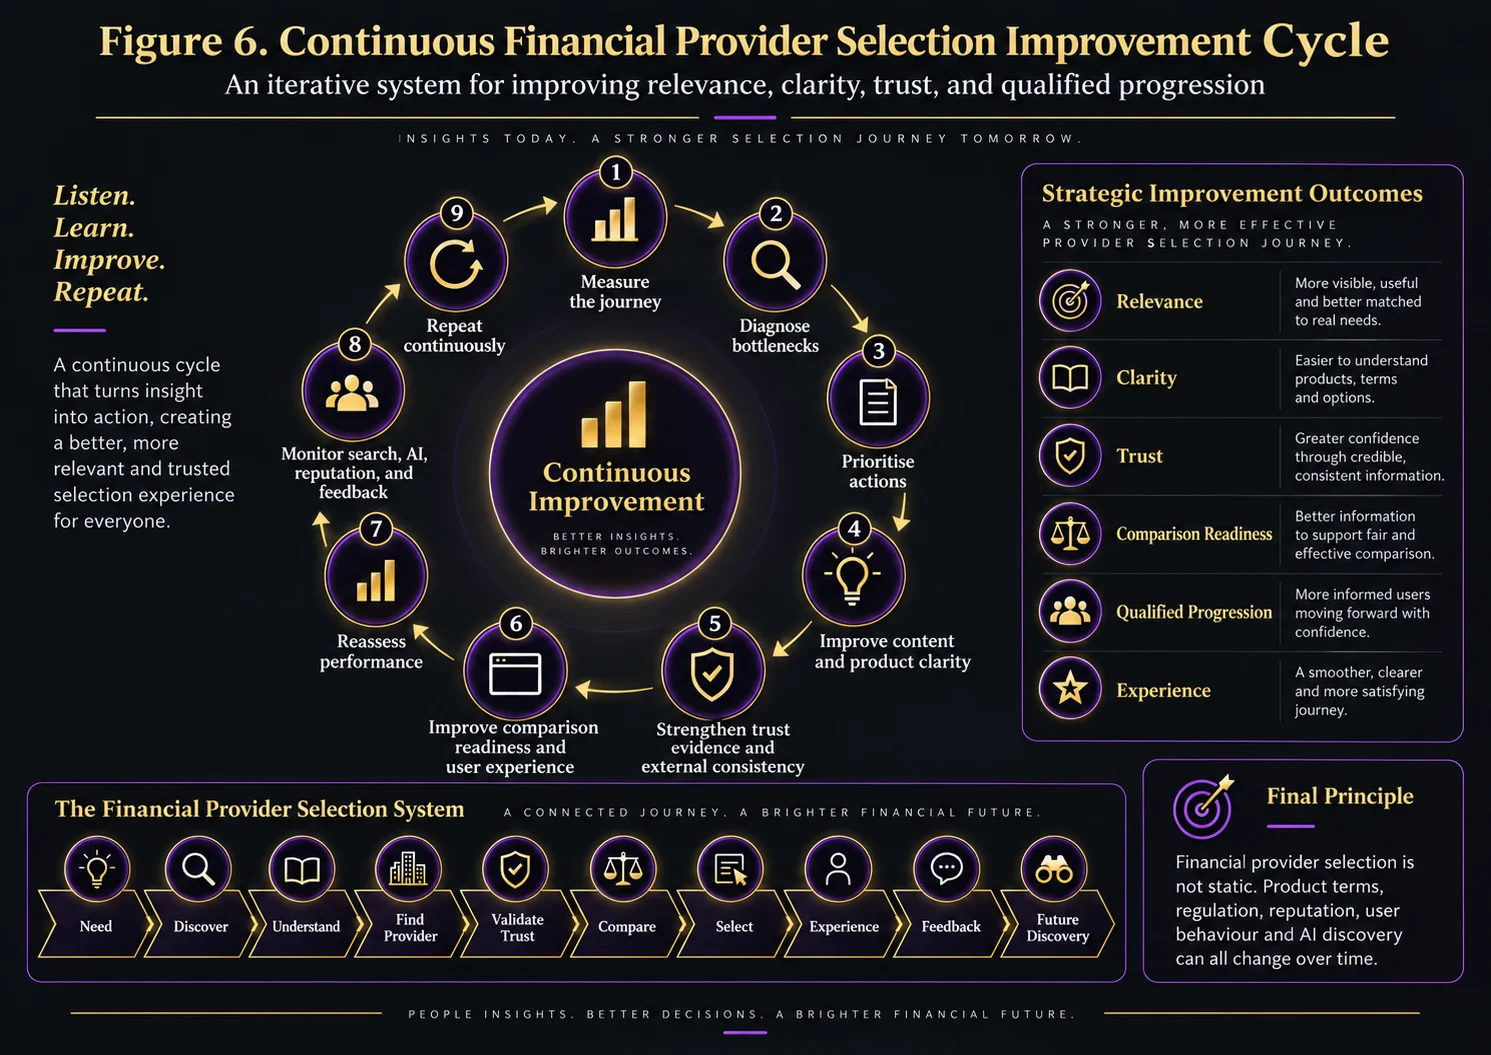
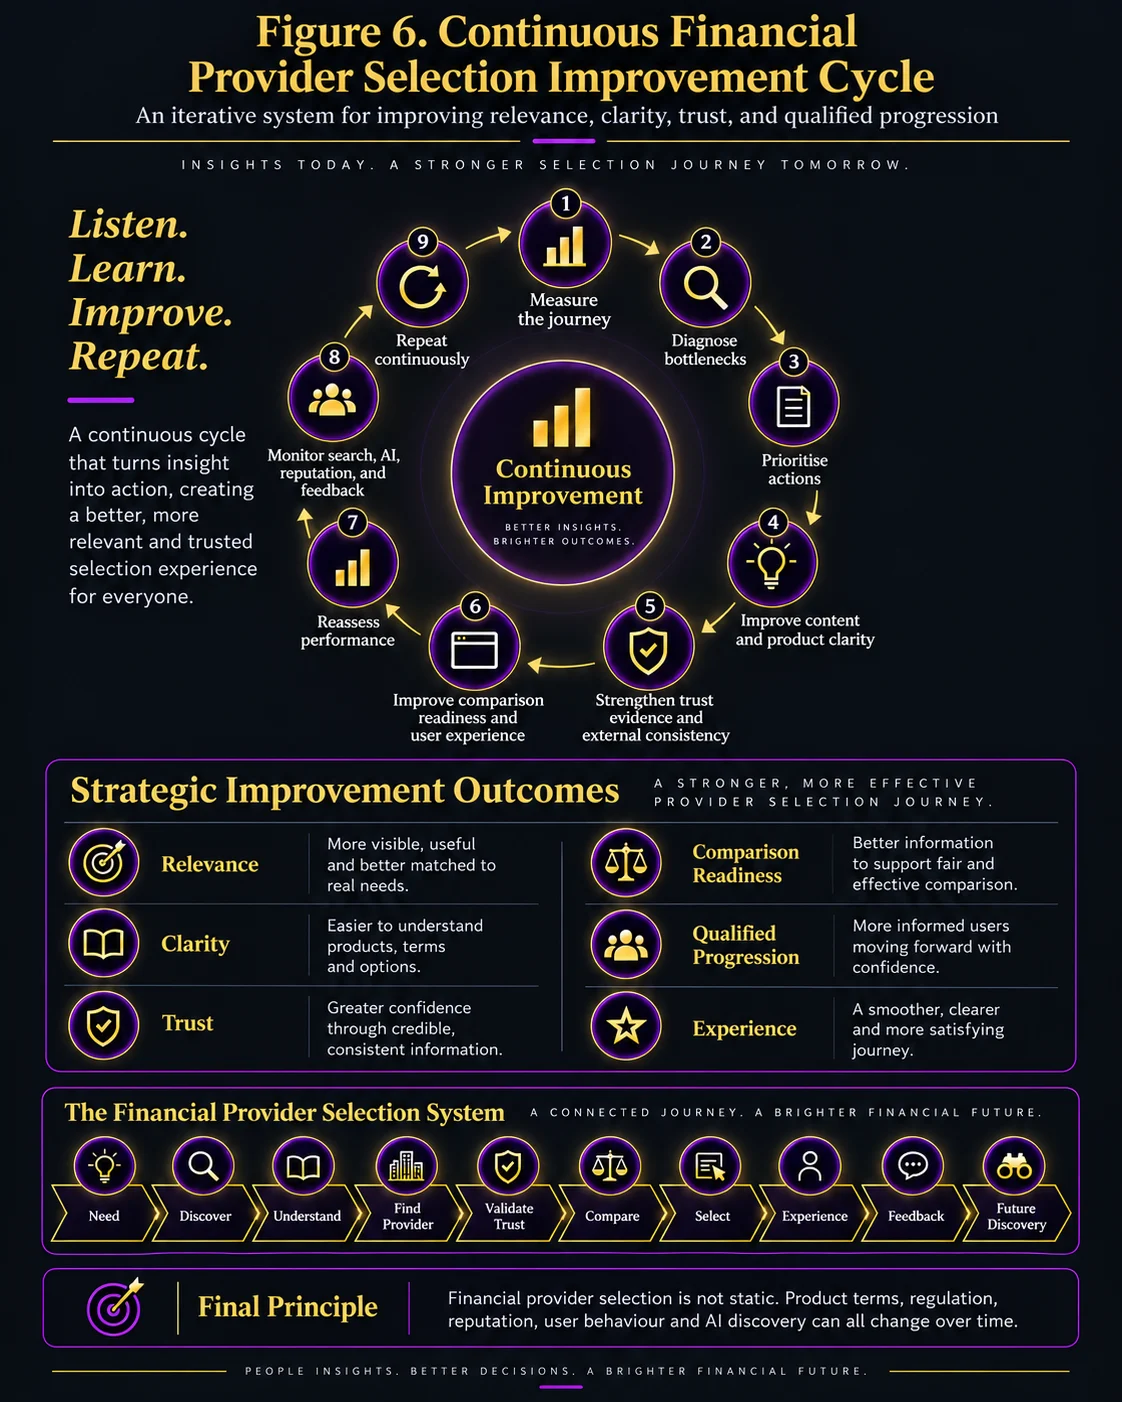
656. Strategic Implications
The Financial Provider Selection Model shows that financial provider discovery is not a single search event. It is a layered decision process shaped by information, product understanding, provider visibility, trust evidence, comparison and final action.
657. Financial Visibility Should Be Evaluated Across the Full Journey
Providers that optimise only for late-stage product keywords may enter the decision process after other organisations have already influenced user understanding and provider preference.
658. Early-Stage Financial Information Creates Strategic Opportunity
Problem-led and goal-led information can help financial organisations participate before users have selected a product category or provider shortlist.
659. Product Understanding Is a Critical Bridge
Users need to understand costs, eligibility, risk, features and limitations before they can compare providers meaningfully.
660. Provider Discovery Requires More Than Website Visibility
Financial organisations may be discovered through:
- Search engines
- AI assistants
- Comparison platforms
- Financial media
- Regulatory sources
- Professional referrals
661. Trust Validation Is a Distinct Competitive Stage
A provider may be visible and relevant yet still be eliminated if users cannot verify its identity, regulatory context, reputation or product transparency.
662. Comparison Should Focus on Suitability
Financial provider comparison should not be reduced to a universal “best provider” concept.
Selection depends on the interaction between:
- User need
- Eligibility
- Cost
- Risk
- Service
- Practical fit
663. Price Is One Variable Within a Wider Decision Model
The cheapest provider may not be preferred where users place greater value on trust, service, flexibility, integration or operational reliability.
664. Provider Selection Is Also an Elimination Process
Financial organisations can leave the consideration set because of:
- Weak discovery
- Poor information
- Trust concerns
- Product mismatch
- Application friction
665. Appropriate Elimination Can Be Beneficial
Clear eligibility, product and risk information can reduce unsuitable applications and improve the quality of later-stage demand.
666. AI Can Compress the Financial Decision Journey
Generative systems may combine information discovery, product explanation, provider discovery, trust questions and comparison within a single conversational session.
667. AI Compression Increases the Importance of Public Evidence
Providers need clear and current information that can be interpreted correctly across machine-mediated discovery environments.
668. AI Visibility Is Not Equivalent to Financial Suitability
Inclusion within a generated answer should not be interpreted as independent certification, regulatory approval or proof that a provider is suitable for an individual user.
669. AI Recommendation Order Is Not a Stable Ranking
Provider ordering may vary across:
- Prompts
- Models
- Locations
- Time
- Available sources
670. AI Monitoring Should Focus on Material Accuracy
Priority observations include whether generated systems describe:
- Provider identity
- Products
- Pricing
- Availability
- Regulatory context
accurately.
671. Search, Product and Trust Teams Should Work Together
Financial provider selection cannot be improved sustainably through SEO activity alone.
672. Product Teams Shape Comparison Performance
Pricing, product design, eligibility and feature strength directly influence provider shortlisting.
673. Compliance and Governance Shape Trust
Clear regulatory information and accurate provider identity support financial confidence.
674. Customer Service Shapes Future Discovery
Real customer experiences create reviews, referrals, complaints and reputation evidence that influence future provider selection.
675. Provider Selection Is Therefore Circular
The wider system can be represented as:
Discovery → Evaluation → Selection → Experience → Reputation → Future Discovery
676. Measurement Should Reflect the Full Journey
Traffic, rankings and application volume alone provide an incomplete picture of financial provider-selection performance.
677. Stronger Measurement Includes Stage Progression
Useful analysis may include:
- Need-to-information progression
- Information-to-product progression
- Product-to-provider progression
- Trust-to-comparison progression
- Comparison-to-action progression
- Action-to-completion progression
678. Measurement Should Distinguish Qualified and Unqualified Demand
A lower overall conversion rate can still represent stronger performance if the provider filters unsuitable users earlier and improves qualified completion.
679. Financial Provider Selection Should Be Managed as a System
The model encourages financial organisations to connect:
Search + Product + Trust + Comparison + Conversion + Customer Experience
680. Relationship with the CGO Media Financial Services Research Family
The Financial Provider Selection Model forms one part of the wider CGO Media Financial Services framework family.
Financial Services SEO in an AI Search Environment | Financial Services AI Trust Framework | Financial Search Authority Maturity Model | Financial SEO & AI Implementation Roadmap
681. Relationship with Financial Services SEO in an AI Search Environment
The parent paper Financial Services SEO in an AI Search Environment establishes the wider context for financial search, AI-assisted discovery, trust, entity authority and provider visibility.
682. Relationship with the Financial Services AI Trust Framework
The Financial Services AI Trust Framework explains the trust architecture that supports financial provider credibility across search and AI environments.
683. Relationship with the Financial Search Authority Maturity Model
The Financial Search Authority Maturity Model provides a staged structure for assessing how effectively a financial organisation develops and governs search authority.
684. Relationship with the Financial SEO & AI Implementation Roadmap
The Financial SEO & AI Implementation Roadmap translates financial search and authority principles into a practical implementation programme.
685. Methodology
The Financial Provider Selection Model is a conceptual research framework developed by CGO Media to describe the stages through which consumers and businesses may progress when identifying, evaluating and selecting a financial provider.
686. Seven Primary Journey Stages
- Financial Need Recognition
- Information Discovery
- Product Understanding
- Provider Discovery
- Trust Validation
- Provider Comparison
- Selection and Action
687. Need Recognition Method
The model begins with the financial problem, objective, cost concern or risk that initiates the decision process.
688. Information Discovery Method
The model considers the environments through which users may learn about possible financial solutions.
689. Product Understanding Method
The model examines whether users can understand:
- Purpose
- Eligibility
- Costs
- Features
- Risks
- Restrictions
690. Provider Discovery Method
The model considers how organisations enter the active provider consideration set through traditional search, AI, comparison, media, regulatory and referral channels.
691. Trust Validation Method
The model considers evidence around:
- Provider identity
- Regulatory context
- Reputation
- Security
- Transparency
692. Provider Comparison Method
The model evaluates how users compare:
- Cost
- Features
- Eligibility
- Risk
- Service
- Practical fit
693. Selection and Action Method
The model examines progression from shortlist toward:
- Application
- Purchase
- Account opening
- Consultation
- Onboarding
694. Post-Selection Feedback Method
The model extends beyond initial conversion to consider how customer experience contributes to future reputation and discovery.
695. Journey Measurement Method
The framework proposes measurement across:
- Discovery
- Engagement
- Trust
- Comparison
- Application
- Completion
- Experience
696. Evidence Confidence
Measurement findings can be interpreted using:
- Low confidence
- Medium confidence
- High confidence
697. Attribution Method
The model recognises that financial provider-selection journeys may involve multiple channels and therefore encourages analysis beyond last-click attribution.
698. AI Observation Method
AI representation can be assessed through repeatable prompt groups covering:
- Provider discovery
- Product discovery
- Trust
- Comparison
- Local or market relevance
699. AI Observation Should Be Longitudinal
Repeated observations are more useful than isolated screenshots because generated outputs can vary over time.
700. Limitations
The Financial Provider Selection Model is a conceptual research framework and should not be interpreted as a regulatory, suitability, investment, lending or financial-advice methodology.
701. Financial Journeys Differ by Product
The decision process for a mortgage may differ substantially from the process for a payment account, insurance policy or business-finance facility.
702. Financial Journeys Differ by Audience
Consumers, SMEs and enterprise buyers may have different:
- Information needs
- Trust thresholds
- Procurement processes
- Decision criteria
703. Financial Journeys Differ by Jurisdiction
Regulation, product availability, terminology and consumer protections vary between markets.
704. Financial Journeys Are Not Fully Linear
Users may move repeatedly between information, trust, comparison and selection stages.
705. Search Data Is Incomplete
Search visibility cannot reveal every offline, referral or cross-device influence.
706. Comparison Platform Data Is Context-Specific
Provider visibility can depend on filters, commercial models and product availability.
707. Review Data Has Limitations
Customer reviews may describe experience but do not establish product suitability or regulatory quality.
708. Attribution Is Imperfect
A user may encounter several information sources before the final measurable application event.
709. AI Outputs Are Variable
Generated answers can differ according to:
- Prompt wording
- Model
- Location
- Time
- Retrieval system
710. Visible AI Citations May Be Incomplete
The sources shown alongside an answer may not represent every signal that contributed to the generated output.
711. AI Source Appearance Does Not Establish Full Causation
A visible source should not automatically be treated as the sole reason a provider was included or described in a particular way.
712. Provider Inclusion Is Not Endorsement
Appearance in an AI-generated response does not constitute regulatory approval, financial advice or independent validation of suitability.
713. Provider Ordering Is Not a Stable Ranking
The order in which providers appear in one generated answer should not be interpreted as a permanent market ranking.
714. The Model Does Not Determine Product Suitability
Individual financial suitability depends on circumstances that may require appropriate professional or regulated advice.
715. The Model Does Not Guarantee Search Rankings
Implementing the principles described here does not guarantee a particular position in traditional or local search.
716. The Model Does Not Guarantee AI Visibility
No provider can guarantee inclusion, citation or recommendation by a particular AI system.
717. The Model Does Not Guarantee Conversion
Provider selection depends on product, pricing, user circumstances, eligibility and wider competitive conditions.
718. Conclusion
Financial provider selection increasingly takes place across a distributed ecosystem of search engines, AI assistants, comparison platforms, provider websites, regulatory sources, reviews, financial media and professional recommendations.
The strongest financial search strategies therefore need to address more than rankings.
They need to understand how users recognise a financial need, learn about potential solutions, understand products, discover providers, validate trust, compare alternatives and take action.
The Financial Provider Selection Model provides a structured framework for examining that journey and identifying where relevant users are gained, retained or lost.
Its central principle is:
Relevant Discovery → Clear Understanding → Verifiable Trust → Meaningful Comparison → Qualified Selection
The model also recognises that the journey does not end at conversion. Customer experience becomes part of the evidence environment influencing future provider discovery, trust and selection.
References
External Academic, Regulatory, Technical and Search Sources
- Google Search Central. SEO Starter Guide.
- Google Search Central. Understand how structured data works.
- Schema.org. FinancialService.
- Schema.org. Organization.
- Hogan, A. et al. (2021). Knowledge Graphs. ACM Computing Surveys, 54(4).
- Metzger, M.J. (2007). Making Sense of Credibility on the Web: Models for Evaluating Online Information and Recommendations for Future Research. Journal of the American Society for Information Science and Technology, 58(13), 2078–2091.
- Ji, Z. et al. (2023). Survey of Hallucination in Natural Language Generation. ACM Computing Surveys, 55(12).
CGO Media Financial Services Research and Frameworks
- Wilkinson, R. (2026). Financial Services SEO in an AI Search Environment. CGO Media.
- Wilkinson, R. (2026). Financial Services AI Trust Framework. CGO Media.
- Wilkinson, R. (2026). Financial Search Authority Maturity Model. CGO Media.
- Wilkinson, R. (2026). Financial SEO & AI Implementation Roadmap. CGO Media.
- Wilkinson, R. (2026). Financial GEO: Generative Engine Optimisation.
CGO Media Research Ecosystem
CGO Media Research Library | CGO Media Framework Library | CGO Media Research Architecture
About Roger Wilkinson
Roger Wilkinson is an independent researcher, SEO practitioner and founder of CGO Media with more than 25 years of experience in search, digital visibility and business growth.
His research focuses on how artificial intelligence is reshaping search engines, recommendation systems, entity representation, digital authority and organisational visibility.
Roger is the creator of the CGO Framework Series, a collection of research-led methodologies designed to help organisations measure, improve and govern Search Visibility, AI Visibility and Digital Authority.
His work examines the relationship between Technical SEO, Entity Authority, Content Authority, Citation Authority, Brand Signals, Knowledge Architecture and AI Search Readiness.
View Roger Wilkinson’s researcher profile →
Related Financial Services Research and Frameworks
Financial Services SEO in an AI Search Environment |
Financial Services AI Trust Framework |
Financial Search Authority Maturity Model |
Financial SEO & AI Implementation Roadmap |
Financial GEO: Generative Engine Optimisation
Research Usage & Citation
CGO Media encourages researchers, journalists, financial organisations, educators, professional-services firms and industry analysts to reference this model where it contributes to wider discussion and understanding of financial search, provider discovery, trust, comparison behaviour and AI-assisted selection.
Reasonable quotations, summaries, figures and excerpts may be used in articles, reports, presentations, academic work and other publications provided appropriate acknowledgement is given to Roger Wilkinson and CGO Media.
Cite This Framework / Embed Citation
The Financial Provider Selection Model by Roger Wilkinson at CGO Media provides a seven-stage framework for understanding how consumers and businesses move from financial need recognition through information discovery, product understanding, provider discovery, trust validation, comparison and final provider selection.
APA Citation
APA Citation: Wilkinson, R. (2026). Financial Provider Selection Model. CGO Media. https://cgomedia.com/financial-provider-selection-model/
Author: Roger Wilkinson | Published by: CGO Media
For permissions relating to extensive reproduction, commercial licensing or republication of substantial portions of this framework, please contact CGO Media directly.